Concept Enumeration and Dependencies
Summary
This chapter teaches you how to enumerate concepts for your learning graph and map their dependencies. You'll learn the process of generating approximately 200 concepts from a course description, following specific requirements for concept labels including Title Case convention and maximum character length. The chapter emphasizes the importance of concept granularity and creating atomic concepts that represent single, clear ideas.
You'll also learn about the CSV file format used for learning graphs, including pipe-delimited dependencies and the structure of ConceptID, ConceptLabel, and Dependencies fields. The chapter introduces taxonomy categorization and distinguishes between foundational, prerequisite, and advanced concepts in your knowledge graph.
Concepts Covered
This chapter covers the following 18 concepts from the learning graph:
- Concept Enumeration Process
- Generating 200 Concepts
- Concept Label Requirements
- Title Case Convention
- Maximum Character Length
- Concept Granularity
- Atomic Concepts
- Dependency Mapping Process
- CSV File Format for Graphs
- Pipe-Delimited Dependencies
- ConceptID Field
- ConceptLabel Field
- Dependencies Field
- Foundational Concepts
- Prerequisite Concepts
- Advanced Concepts
- Taxonomy
- Concept Categorization
Prerequisites
This chapter builds on concepts from:
The Concept Enumeration Process
Concept enumeration transforms a course description into a comprehensive inventory of atomic knowledge units, typically yielding 150-250 concepts that collectively define the course's knowledge domain. This process requires balancing breadth (covering all relevant topics) with appropriate granularity (ensuring concepts are atomic and assessable).
The enumeration process follows a systematic workflow:
Extract topics from course description: The main topics section provides the high-level structure. Each topic typically expands into 10-20 concepts depending on scope and complexity.
Identify foundational concepts: Examine prerequisites to determine what concepts can be assumed versus what must be included. Course prerequisites define the boundary—concepts below that threshold are excluded; concepts at or above it are enumerated.
Expand topics into concept hierarchies: For each main topic, generate a hierarchical breakdown: what are the key components? What procedures must learners master? What terminology is domain-specific?
Apply atomicity criteria: Ensure each proposed concept is atomic—representing a single, cohesive idea assessable in isolation. Split overly broad concepts; merge overly narrow fragments.
Verify domain coverage: Cross-reference generated concept list against learning outcomes. Are all cognitive levels addressed? Do concepts enable assessment of all stated outcomes?
Eliminate duplicates and resolve overlaps: Identify concepts with significant overlap, merging or refining to maintain distinctness.
For AI-assisted enumeration via the learning-graph-generator skill, the course description provides essential context. Rich topic lists with 20-30 entries enable more accurate concept generation than sparse lists with 5-10 entries. Learning outcomes aligned with Bloom's Taxonomy signal which cognitive levels to emphasize, influencing the mix of definitional concepts (Remember), procedural concepts (Apply), and analytical concepts (Analyze, Evaluate).
Diagram: Topic-to-Concept Expansion Process
1 2 3 4 5 6 7 8 9 10 11 12 13 14 15 16 17 18 19 20 21 22 23 24 25 26 27 28 29 30 31 32 33 34 35 36 37 38 39 40 41 42 43 44 45 46 47 48 49 50 51 52 53 54 55 56 57 58 59 | |
MicroSim Generator Recommendations:
- mermaid-generator (Score: 92/100) - Excellent for hierarchical tree showing topic expansion with branches for components, relationships, procedures
- vis-network (Score: 85/100) - Good for interactive tree with color-coded concept types and hierarchical layout
- microsim-p5 (Score: 75/100) - Could create custom tree visualization with color-coded branches
Generating 200 Concepts
The target of approximately 200 concepts for a semester-length course derives from pedagogical research on cognitive load, assessment scope, and knowledge retention. Courses with fewer than 100 concepts risk insufficient depth; courses with more than 300 concepts overwhelm learners and instructors alike.
Rationale for 200-concept target:
Cognitive chunk size: Human working memory effectively processes 5-9 chunks of information simultaneously. A 13-chapter textbook with ~15 concepts per chapter yields 195 concepts—manageable chunks aligned with chapter-based learning.
Assessment coverage: Quality courses assess concept mastery comprehensively. With 200 concepts and ~10 quiz questions per chapter (130 total questions), each concept receives 0.5-1 assessment items—adequate for formative assessment without excessive testing burden.
Semester pacing: 15-week semesters with 3 contact hours per week provide 45 hours instruction time. Covering 200 concepts yields ~13 minutes per concept—sufficient for introduction, examples, and practice for atomic concepts.
Content generation tractability: AI-assisted content generation produces higher quality when working with well-scoped concepts. Extremely broad concepts ("All of Database Theory") yield generic content; extremely narrow concepts ("The third parameter of function X") yield trivial content. 200 atomic concepts hits the sweet spot.
Flexibility across course lengths:
- Short courses (4-6 weeks): Target 80-120 concepts
- Semester courses (12-15 weeks): Target 180-220 concepts
- Year-long courses: Target 350-450 concepts (split into 2 semester graphs)
The learning-graph-generator skill defaults to 200 concepts but accepts guidance in the course description. A statement like "This is an intensive 6-week boot camp" signals to generate ~100 concepts; "This is a comprehensive two-semester sequence" signals ~400 concepts split into multiple graphs.
Diagram: Concept Count by Course Duration
1 2 3 4 5 6 7 8 9 10 11 12 13 14 15 16 17 18 19 20 21 22 23 24 25 26 27 28 | |
MicroSim Generator Recommendations:
- chartjs-generator (Score: 98/100) - Perfect for bar chart showing concept count by duration with range error bars - Chart.js explicitly mentioned
- microsim-p5 (Score: 55/100) - Could create custom bar chart but Chart.js already provides this well
- math-function-plotter-plotly (Score: 35/100) - Not plotting functions, this is discrete data
Concept Label Requirements
Concept labels serve as human-readable identifiers appearing in learning graphs, chapter headings, quiz questions, and glossary entries. Standardized labeling conventions ensure consistency across automated content generation and enable effective search and reference.
Required conventions:
Title Case capitalization: Every concept label follows Title Case convention—capitalizing the first letter of major words while keeping articles, conjunctions, and short prepositions lowercase. Examples: - "Large Language Models Overview" (correct) - "Large language models overview" (incorrect—sentence case) - "LARGE LANGUAGE MODELS OVERVIEW" (incorrect—all caps)
Maximum character length: Concept labels must not exceed 32 characters including spaces. This constraint ensures labels fit in UI elements (navigation menus, graph node displays, table columns) without truncation.
Technical precision: Use domain-standard terminology rather than colloquialisms or abbreviations. "Directed Acyclic Graph (DAG)" rather than "Graph Without Cycles"; "Bloom's Taxonomy" rather than "Learning Objectives Framework."
Singular form preference: Use singular rather than plural unless the plural form is the standard term. "Concept Node" not "Concept Nodes"; "Learning Graph" not "Learning Graphs." Exception: when the plural is the established term (e.g., "Claude Skills" is acceptable).
Acronym handling: For well-known acronyms, include both expansion and acronym on first use, acronym only thereafter. "Directed Acyclic Graph (DAG)" for first mention, "DAG Properties" for subsequent concepts.
Avoid gerunds in favor of noun forms: "Concept Enumeration" rather than "Enumerating Concepts"; "Dependency Mapping" rather than "Mapping Dependencies." This aligns with knowledge domain nomenclature conventions.
Diagram: Concept Label Quality Checklist
1 2 3 4 5 6 7 8 9 10 11 12 13 14 15 16 17 18 19 20 21 22 23 24 25 26 27 28 29 30 31 32 33 34 35 36 37 38 39 40 41 42 | |
MicroSim Generator Recommendations:
- microsim-p5 (Score: 90/100) - Excellent for interactive checklist with click/hover functionality and visual examples with checkmarks/X marks
- chartjs-generator (Score: 20/100) - Not a chart, this is an interactive checklist/infographic
- mermaid-generator (Score: 30/100) - Could show as diagram but lacks interactive checklist features
Title Case Convention
Title Case capitalization follows specific rules differentiating words that should be capitalized from those that remain lowercase:
Always capitalize: - First word of the label - Last word of the label - All nouns, pronouns, verbs, adjectives, and adverbs - Acronyms and initialisms
Keep lowercase: - Articles: a, an, the - Coordinating conjunctions: and, but, or, nor, for, yet, so - Prepositions of four or fewer letters: in, on, at, to, for, from, with - The word "as" when used as a conjunction - Infinitive "to"
Examples demonstrating Title Case: - "Learning Graph Generation from Course Descriptions" (prepositions "from" lowercase) - "Difference Between Skills and Commands" (article "and" lowercase) - "Directed Acyclic Graph for Dependency Modeling" (preposition "for" lowercase) - "Create New Skills from Scratch" (infinitive "to" implied, capitalized properly)
For AI-generated content, the learning-graph-generator skill applies Title Case automatically, but manual concept refinement may require correcting capitalization to maintain consistency.
Maximum Character Length
The 32-character constraint balances information density with usability across contexts where concept labels appear:
UI contexts requiring brevity: - Graph visualization node labels (space-constrained visual display) - Navigation menu entries (narrow sidebar menus) - Table of contents listings (mobile device displays) - Quiz question stems (avoiding label line breaks) - Glossary section headers (visual scanability)
Strategies for meeting length constraint:
Use standard abbreviations: "DAG" instead of "Directed Acyclic Graph" in concept labels after the first definitional concept establishes the expansion.
Eliminate redundant modifiers: "Chapter Structure" rather than "Textbook Chapter Structure" (context establishes we're discussing textbooks).
Favor precision over completeness: "Learning Graph Quality" (29 chars) rather than "Learning Graph Quality Validation Metrics" (46 chars).
Split overly broad concepts: If a label exceeds 32 characters, the concept may not be sufficiently atomic. Consider splitting: "Learning Graph Generation Process and Quality Validation" (56 chars) becomes two concepts: "Learning Graph Generation" + "Learning Graph Quality Validation."
The character count includes all letters, spaces, punctuation, and symbols. "Bloom's Taxonomy (2001)" counts as 23 characters including spaces and parentheses.
Diagram: Concept Label Length Optimization
1 2 3 4 5 6 7 8 9 10 11 12 13 14 | |
MicroSim Generator Recommendations:
- chartjs-generator (Score: 20/100) - This is a markdown table, not a chart - better as plain markdown
- microsim-p5 (Score: 50/100) - Could create interactive table showing before/after optimization but markdown suffices
- mermaid-generator (Score: 10/100) - Not designed for table representations
Concept Granularity
Concept granularity—the level of detail and scope at which concepts are defined—critically impacts learning graph quality, content generation effectiveness, and assessment design. Optimal granularity balances atomic precision with pedagogical coherence.
Granularity spectrum:
Too coarse (overly broad): - Example: "All of Machine Learning" - Problem: Cannot assess specifically, dependencies unclear, content too general - Resolution: Split into atomic concepts (Supervised Learning, Unsupervised Learning, Feature Engineering, Model Evaluation, etc.)
Optimal (atomic): - Example: "Directed Acyclic Graph (DAG)" - Characteristics: Single cohesive idea, assessable independently, clear prerequisites, domain-standard term - This is the target granularity for learning graph concepts
Too fine (overly narrow): - Example: "The Third Parameter of the csv_to_json Function" - Problem: Trivial to assess, creates dependency explosion, generates trivial content - Resolution: Merge into broader procedural concept (CSV File Processing)
Granularity assessment criteria:
Assessability test: Can you write a meaningful quiz question testing this concept specifically? If yes, granularity is likely appropriate.
Dependency test: Does this concept have clear prerequisites at similar abstraction level? If dependencies are either "everything" or "nothing," granularity may be wrong.
Content generation test: Would this concept yield a substantial section (2-3 paragraphs with examples) in chapter content? If it yields only a single sentence or requires a full chapter, granularity is misaligned.
Terminology test: Is this concept referenced in domain literature using this specific term? Domain-standard concepts have appropriate granularity; ad-hoc invented concepts may be too fine.
Achieving consistent granularity across 200 concepts requires iterative refinement. The learning-graph-generator produces initial concepts at mixed granularity; manual review identifies and resolves granularity mismatches before finalizing the graph.
Diagram: Concept Granularity Spectrum Visualization
1 2 3 4 5 6 7 8 9 10 11 12 13 14 15 16 17 18 19 20 21 22 23 24 25 26 27 28 29 30 31 32 33 34 35 36 37 38 | |
MicroSim Generator Recommendations:
- microsim-p5 (Score: 88/100) - Excellent for custom spectrum visualization with positioned examples and color-coded zones
- chartjs-generator (Score: 45/100) - Could use horizontal bar but spectrum metaphor needs custom visualization
- mermaid-generator (Score: 40/100) - Could show as diagram but lacks spectrum-specific styling
Atomic Concepts
An atomic concept represents the smallest meaningful knowledge unit suitable for independent instruction and assessment. Atomicity ensures concepts are neither so broad they encompass multiple distinct ideas nor so narrow they lack pedagogical substance.
Atomic concept characteristics:
Single cohesive idea: The concept addresses one identifiable topic, procedure, or principle. "Topological Sorting" is atomic (one algorithmic concept); "Graph Algorithms" is not (umbrella for many algorithms).
Independently learnable: While the concept may have prerequisites, it can be understood and assessed without simultaneous introduction of other concepts. "Dependency Edges" is atomic and teachable given prerequisite "Graph Structure"; "Dependency Edges and Topological Sorting" conflates two concepts.
Distinct from related concepts: The concept maintains clear boundaries from sibling concepts. "Concept Nodes" and "Dependency Edges" are distinct; "Concept Nodes and Other Graph Elements" lacks distinctness.
Assessable in isolation: Quiz questions can target this specific concept. "What is a Directed Acyclic Graph?" is assessable; "What is graph theory?" is too broad for specific assessment.
Domain-standard terminology: The concept label matches how domain experts refer to the idea, ensuring alignment with external resources and professional discourse.
Atomic concept examples from this course:
| Atomic Concept | Why Atomic | Non-Atomic Alternative | Why Not Atomic |
|---|---|---|---|
| Claude Skill | Single tool type, distinct from commands | Claude Automation | Too broad, conflates skills and commands |
| YAML Frontmatter | Specific skill file component | Skill Metadata | Too vague, encompasses multiple elements |
| Learning Graph | Single artifact type | Course Planning Documents | Too broad, includes other artifacts |
| DAG Requirement | Specific constraint | Graph Properties | Too broad, many properties exist |
Maintaining atomicity across 200 concepts requires discipline. The temptation to create compound concepts like "Installing and Invoking Skills" must be resisted—split into "Installing Claude Skill" and "Invoking Skills with Slash Commands" as distinct atomic concepts with clear dependency relationship.
Dependency Mapping Process
Dependency mapping transforms the flat concept inventory into a structured graph by identifying prerequisite relationships. This process demands domain expertise to distinguish true pedagogical dependencies from mere topical relationships.
Dependency mapping workflow:
1. Identify foundational concepts: Concepts with zero dependencies serve as entry points. These typically include: - Definitional concepts for the domain ("Artificial Intelligence," "Claude AI") - Tool/platform concepts learners must start with ("Claude Code Interface") - Prerequisite knowledge restated for context ("Programming Basics")
Mark these concepts as foundational, assigning them no incoming edges.
2. Build sequential chains: Identify linear progressions where concept B clearly requires A, C requires B, D requires C: - "Installing Claude Skill" → "Listing Available Skills" → "Invoking Skills" - "Course Description" → "Learning Graph Generation" → "Chapter Structure"
These sequential dependencies are often procedural (steps in a process) or hierarchical (specific instance of general class).
3. Map convergent dependencies: Advanced concepts often require multiple prerequisites converging: - "Learning Graph Quality Validation" requires both "Learning Graph" and "DAG Properties" - "Chapter Content Generation" requires "Chapter Structure," "Reading Level," and "Bloom's Taxonomy"
For concept C with prerequisites A and B, add edges A → C and B → C.
4. Verify transitivity: Check whether proposed edge A → C is transitive (implied by A → B → C) or direct (genuinely first-order prerequisite). Remove transitive edges to keep the graph sparse and maintainable.
5. Detect and resolve cycles: Run cycle detection algorithm (DFS-based or topological sort). If cycles found: - Examine concepts in cycle to identify granularity mismatch (split overly broad concepts) - Determine pedagogical primacy (which concept is truly foundational to the other) - Break cycle by removing weakest dependency edge
Repeat until DAG constraint satisfied.
6. Validate dependency strengths: Review edge set to ensure all dependencies represent true prerequisites, not merely "helpful background." Weak dependencies should be omitted unless they significantly aid learning.
The learning-graph-generator skill automates much of this process using LLM reasoning about concept relationships, but manual review typically identifies 10-20% of dependencies requiring adjustment—either missing edges (under-specification) or spurious edges (over-specification).
Diagram: Dependency Mapping Workflow
1 2 3 4 5 6 7 8 9 10 11 12 13 14 15 16 17 18 19 20 21 22 23 24 25 26 27 28 29 30 31 32 33 34 35 36 37 38 39 40 41 42 43 44 45 | |
MicroSim Generator Recommendations:
- mermaid-generator (Score: 95/100) - Perfect for sequential workflow with decision points, loops, and color-coded phases
- microsim-p5 (Score: 65/100) - Could create custom flowchart but Mermaid already provides workflow patterns
- vis-network (Score: 30/100) - Could show as network but workflow needs sequential structure
CSV File Format for Learning Graphs
Learning graphs are persisted in both CSV (Comma-Separated Values) format and a JSON file format, enabling both human readability for manual editing and programmatic processing by validation scripts and visualization tools. The CSV structure follows a standardized schema essential for downstream skill compatibility.
Required CSV columns:
ConceptID: Integer identifier (1 to n) uniquely identifying each concept. Sequential numbering with no gaps required.
ConceptLabel: String following Title Case convention, maximum 32 characters. Human-readable concept name appearing in all generated content.
Dependencies: Pipe-delimited list of ConceptIDs representing direct prerequisites, or empty string for foundational concepts.
TaxonomyID: (Optional) Short abbreviation (3-5 letters) categorizing the concept. Discussed in Chapter 7.
File format specifications:
Header row: First row must contain column names exactly as specified: ConceptID,ConceptLabel,Dependencies,TaxonomyID
Field delimiters: Commas separate fields. If concept labels contain commas, enclose in double quotes.
Dependency delimiter: Pipe character (|) separates multiple dependency IDs within the Dependencies field.
Line endings: Unix-style line endings (\n) preferred, but Windows (\r\n) accepted.
Character encoding: UTF-8 encoding required to support special characters in concept labels.
Example CSV excerpt:
1 2 3 4 5 6 7 8 | |
The following is a screen image of viewing the sample above in the Visual Studio Editor with a CSV viewer extension.
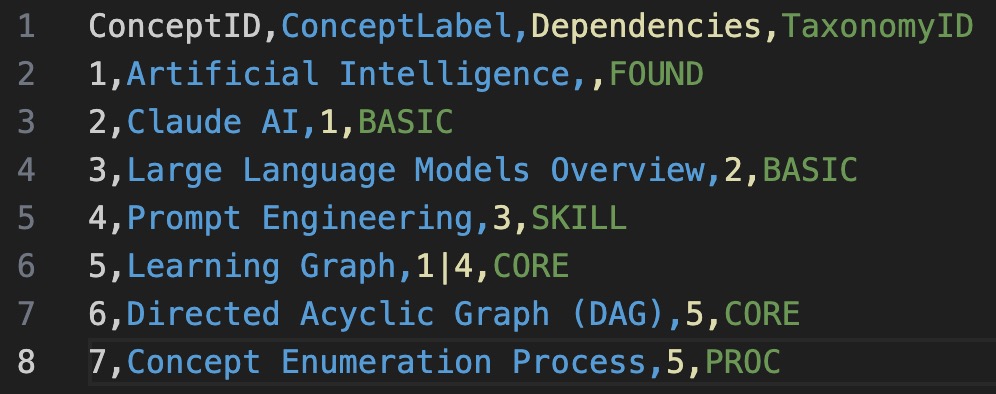
Note that each column has it's own color.
This format enables: - Spreadsheet editing in Excel, Google Sheets, LibreOffice - Programmatic parsing with Python pandas, CSV libraries - Version control with git (text-based diffing) - Conversion to JSON for graph visualization tools
Our skills have python programs that convert CSV into JSON. So the conversion process is simple.
The learning-graph-generator skill outputs properly formatted CSV; manual editing should preserve the format specification to ensure downstream skills function correctly.
Pipe-Delimited Dependencies
The Dependencies column uses pipe (|) delimiters to separate multiple prerequisite ConceptIDs, enabling compact representation of concepts with multiple prerequisites.
Dependency field formats:
Zero dependencies (foundational concept):
1 | |
Single dependency:
1 | |
Multiple dependencies:
1 | |
Ordering within dependency list:
The order of IDs within a pipe-delimited list has no semantic significance—5|7|8 is equivalent to 8|5|7. Topological sorting determines actual pedagogical ordering, not dependency field order.
No spaces around pipes:
Correct: 5|7|8
Incorrect: 5 | 7 | 8 (spaces may cause parsing errors)
All IDs must exist: Every ConceptID referenced in Dependencies must appear as a ConceptID in some row. Referencing non-existent ID 999 causes validation errors.
When manually editing CSV files to add or modify dependencies: 1. Identify the ConceptID of the prerequisite concept 2. Add to Dependencies field using pipe delimiter if multiple 3. Verify all referenced IDs exist 4. Run validation script to check for cycles before proceeding
Diagram: CSV File Format Example with Validation
1 2 3 4 5 6 7 8 9 10 11 12 13 14 15 16 17 18 19 20 21 22 23 24 25 26 27 28 29 30 | |
MicroSim Generator Recommendations:
- chartjs-generator (Score: 15/100) - This is a markdown table with validation examples, not a chart
- microsim-p5 (Score: 55/100) - Could create interactive table highlighting errors but markdown tables work well
- mermaid-generator (Score: 10/100) - Not designed for table representations
Understanding ConceptID, ConceptLabel, and Dependencies Fields
The three core CSV columns—ConceptID, ConceptLabel, and Dependencies—encode all information necessary for learning graph construction, validation, and content generation.
ConceptID Field
ConceptID serves as the immutable identifier for concepts, enabling dependency references and programmatic processing while remaining independent of concept labels that may be refined during development.
ConceptID properties:
Sequential integers starting at 1: The first concept has ID 1, second has ID 2, continuing to n (typically ~200).
No gaps: Every integer from 1 to n must appear exactly once. Gaps (e.g., 1, 2, 4, 5—missing 3) cause validation failures.
Order-independent: ConceptID sequence does not imply pedagogical ordering. Concept 50 may be foundational while Concept 5 is advanced. Dependencies, not ID order, determine teaching sequence.
Immutable after generation: Once dependencies reference ConceptID X, changing X's ID breaks those references. Prefer refining ConceptLabel rather than renumbering.
Use in dependencies: The Dependencies field contains ConceptIDs, not labels. This ensures dependency robustness when labels are refined.
When manually adding concepts to an existing learning graph: - Assign the next available ID (if max ID is 200, new concept gets 201) - Update any dependencies referencing the new concept - Run validation to ensure no ID gaps created
ConceptLabel Field
ConceptLabel provides the human-readable name appearing in all generated content. Labels must balance precision, brevity, and domain-standard terminology.
ConceptLabel standards (review):
- Title Case capitalization
- Maximum 32 characters
- Domain-standard terms
- Singular unless plural is standard
- Noun form preferred over gerund
Refining labels during development:
Unlike ConceptIDs, labels can be refined iteratively: - Initial: "LLM Overview" → Refined: "Large Language Models Overview" - Initial: "Mapping Dependencies" → Refined: "Dependency Mapping Process"
Refinements should maintain consistency across all instances. If "Learning Graph" appears in multiple contexts (e.g., "Learning Graph Generation," "Learning Graph Quality"), ensure the core term remains consistent.
Dependencies Field
The Dependencies field encodes prerequisite relationships as pipe-delimited ConceptID lists, constructing the directed graph structure.
Dependency field semantics:
Empty field (zero dependencies): Foundational concept requiring no prerequisites. Typically 10-15 concepts in a 200-concept graph.
Single ID: Concept depends on exactly one prerequisite. Common for sequential chains.
Pipe-delimited IDs: Concept depends on multiple prerequisites that must all be understood before tackling this concept.
Best practices for dependency specification:
Minimize transitive edges: If A → B → C exists, omit direct A → C edge. The transitive relationship is implied.
Represent true prerequisites only: Only add edge A → B if understanding B genuinely requires first understanding A, not merely "A provides helpful context."
Avoid circular dependencies: Never create cycles like A → B → C → A. DAG constraint must be satisfied.
Reasonable fan-in: While no hard limit exists, concepts depending on 5+ prerequisites often indicate overly advanced or insufficiently atomic concepts. Consider splitting.
Diagram: ConceptID vs ConceptLabel Comparison
1 2 3 4 5 6 7 8 9 10 11 12 13 14 15 16 | |
MicroSim Generator Recommendations:
- chartjs-generator (Score: 15/100) - This is a comparison table, not a chart - better as markdown table
- microsim-p5 (Score: 50/100) - Could create interactive comparison table but markdown suffices
- mermaid-generator (Score: 10/100) - Not designed for comparison tables
Taxonomy and Concept Categorization
While not required for minimal learning graph functionality, taxonomy categorization organizes concepts into thematic groups enabling quality analysis, balanced chapter design, and navigation enhancement. Chapter 7 explores taxonomy in depth; this section introduces the concept.
Taxonomy purposes:
Quality assessment: Ensure balanced coverage across topic areas. If 80% of concepts fall in one taxonomy category, the course may be imbalanced.
Chapter organization: Group related concepts (same taxonomy) into cohesive chapters rather than scattering them across the textbook.
Navigation enhancement: Enable filtering or browsing by category (e.g., "Show all SKILL concepts" or "Show all CORE theory concepts").
Prerequisite validation: Foundational categories should have few dependencies; advanced categories should have many. Violations suggest categorization errors.
Common taxonomy schemes:
Foundational/Basic/Advanced: 3-tier depth categorization - FOUND: Entry-level concepts requiring minimal prerequisites - BASIC: Core concepts building on foundations - ADVANCED: Integrative concepts requiring significant prerequisites
Topic-based: Categories aligned with course topics - GRAPH: Graph database concepts - SKILL: Claude Skills concepts - CONTENT: Content generation concepts - QUALITY: Quality assurance concepts
Procedural/Conceptual/Evaluative: Cognitive type categorization aligned with Bloom's - PROCEDURE: How-to concepts (Apply level) - CONCEPT: Definitional and theoretical (Remember, Understand) - ANALYSIS: Analytical and evaluative (Analyze, Evaluate, Create)
The TaxonomyID field in the CSV stores a 3-5 letter abbreviation for the assigned category. Learning-graph-generator can propose taxonomy categorization based on concept content and dependencies, but manual refinement improves accuracy.
Foundational, Prerequisite, and Advanced Concepts
Concepts naturally stratify into depth tiers based on their position in the dependency graph. Understanding these tiers aids chapter organization and quality assessment.
Foundational concepts: - Zero incoming edges (no dependencies) - Represent entry points to the knowledge graph - Typically 5-10% of total concepts (~10-20 in a 200-concept graph) - Often definitional or prerequisite knowledge restated for context
Examples: "Artificial Intelligence," "Claude Code Interface," "Programming Basics"
Prerequisite/intermediate concepts: - Few incoming edges (1-3 dependencies) - Build on foundations but enable further learning - Represent core course content - Typically 60-70% of total concepts (~120-140 in a 200-concept graph)
Examples: "Claude Skill," "Learning Graph," "Bloom's Taxonomy"
Advanced/integrative concepts: - Many incoming edges (4+ dependencies) - Require synthesis of multiple prerequisite concepts - Represent learning culmination - Typically 20-30% of total concepts (~40-60 in a 200-concept graph)
Examples: "Learning Graph Quality Validation," "Complete Textbook Generation Workflow," "Custom Skill Design"
Distribution analysis:
A healthy learning graph exhibits gradual progression from foundational through intermediate to advanced:
| Tier | Dependency Count | Percent of Concepts | Typical Chapter Placement |
|---|---|---|---|
| Foundational | 0 | 5-10% | Chapters 1-2 |
| Prerequisite | 1-3 | 60-70% | Chapters 2-10 |
| Advanced | 4+ | 20-30% | Chapters 10-13 |
Anomalies suggesting quality issues: - Too many foundational concepts (>15%): Course may lack depth or include unnecessary prerequisites - Too few foundational concepts (<5%): Course may have circular dependencies or missing entry points - No advanced concepts: Course may be too shallow, lacking integrative learning - Too many advanced concepts (>40%): Dependencies may be over-specified or concepts insufficiently atomic
The analyze-graph.py script in the learning-graph-generator skill computes these distributions and flags anomalies in the quality report.
Diagram: Concept Depth Distribution Analysis
1 2 3 4 5 6 7 8 9 10 11 12 13 14 15 16 17 18 19 20 21 22 23 24 25 26 27 28 29 | |
MicroSim Generator Recommendations:
- chartjs-generator (Score: 95/100) - Perfect for stacked area chart showing concept depth progression - Chart.js explicitly mentioned
- microsim-p5 (Score: 70/100) - Could create custom area chart with heat map coloring but Chart.js already provides this
- math-function-plotter-plotly (Score: 40/100) - Not plotting functions, this is stacked categorical data
Summary
This chapter explored the mechanics of concept enumeration and dependency mapping that transform course descriptions into structured learning graphs. You learned the systematic workflow for generating ~200 atomic concepts, applying label conventions (Title Case, 32-character maximum, domain-standard terminology), and maintaining optimal granularity balancing pedagogical coherence with assessability.
We examined the CSV file format specification encoding learning graphs with ConceptID, ConceptLabel, Dependencies, and optional TaxonomyID fields. You learned dependency mapping workflows identifying foundational concepts, building sequential chains, mapping convergent dependencies, and validating DAG constraints.
Finally, we explored how concepts stratify into foundational, prerequisite, and advanced tiers based on dependency depth, and introduced taxonomy categorization for quality analysis and chapter organization. These concept enumeration and dependency mapping skills provide the foundation for the quality validation and learning graph generation workflows in subsequent chapters.
Concepts covered: Concept Enumeration Process ✓, Generating 200 Concepts ✓, Concept Label Requirements ✓, Title Case Convention ✓, Maximum Character Length ✓, Concept Granularity ✓, Atomic Concepts ✓, Dependency Mapping Process ✓, CSV File Format for Graphs ✓, Pipe-Delimited Dependencies ✓, ConceptID Field ✓, ConceptLabel Field ✓, Dependencies Field ✓, Foundational Concepts ✓, Prerequisite Concepts ✓, Advanced Concepts ✓, Taxonomy ✓, Concept Categorization ✓
References
- Path-Based Recommender System for Learning Activities Using Knowledge Graphs - 2023-01-09 - MDPI Information - Research paper presenting a novel path-based recommendation system using knowledge graphs to suggest adequate learning activities through concept dependency relationships, demonstrating practical applications of prerequisite-aware learning pathway generation in educational systems.