List of MicroSims for Clocks and Watches with AI
Interactive MicroSims to help students learn how clocks and watches work, from binary counting and seven-segment displays to shift registers and analog clock faces.
-
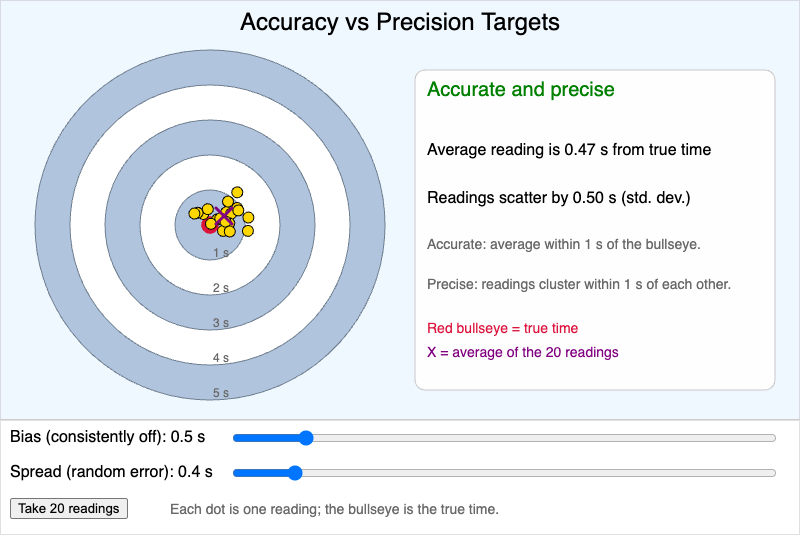
A dartboard target where the bullseye is the true time and each dot is a clock reading. Bias and spread sliders show the difference between an accurate clock and a precise one.
-
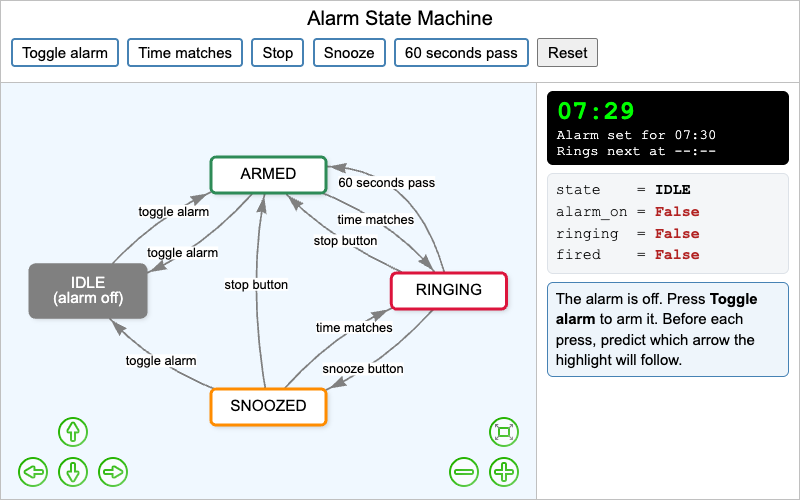
Press alarm events and watch an alarm clock's state machine move between IDLE, ARMED, RINGING and SNOOZED while a small clock model and the alarm_on, ringing and fired variables update.
-

Interactive p5.js analog clock simulation with manual and automatic modes, demonstrating trigonometric functions for hand positioning
-
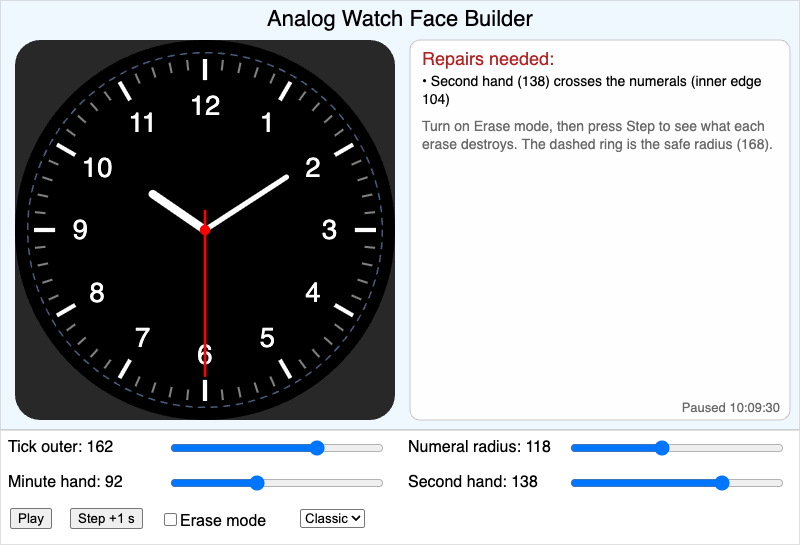
Design an analog face for a 360 by 360 round display by choosing tick, numeral, and hand radii and a color palette, then use Erase mode to see which pixels an erased second hand destroys and which repairs the layout needs.
-
Interactive visualization showing progressive zoom levels of clock system architecture from high-level to component details
-

Interactive p5.js simulation demonstrating battery discharge rates when powering a motor at different speeds
-
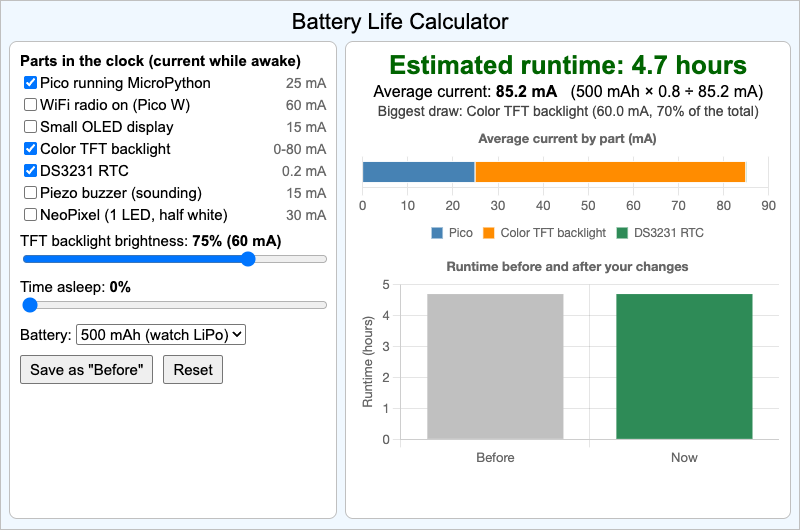
Choose a clock's parts, backlight brightness, sleep time and battery, then compare the estimated runtime before and after your design changes.
-
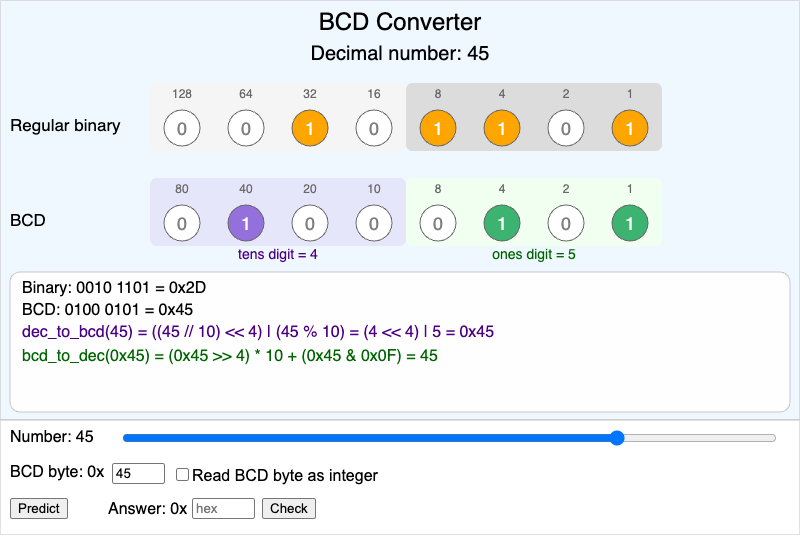
Compare ordinary binary with BCD for the numbers 0 to 59, decode raw RTC register bytes, see the read-as-integer mistake, and practice encoding numbers as BCD bytes.
-
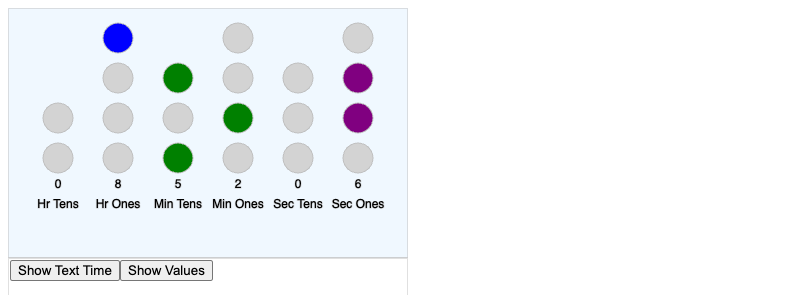
Interactive p5.js simulation displaying current time in binary format using vertical LED columns
-
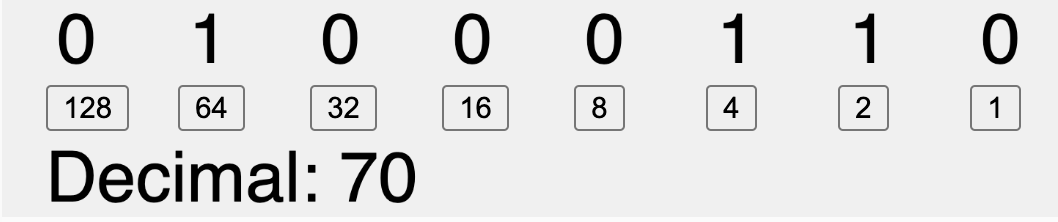
Interactive p5.js simulation for learning binary numbers with toggle buttons and decimal conversion display
-
Bounding Box and Partial Update
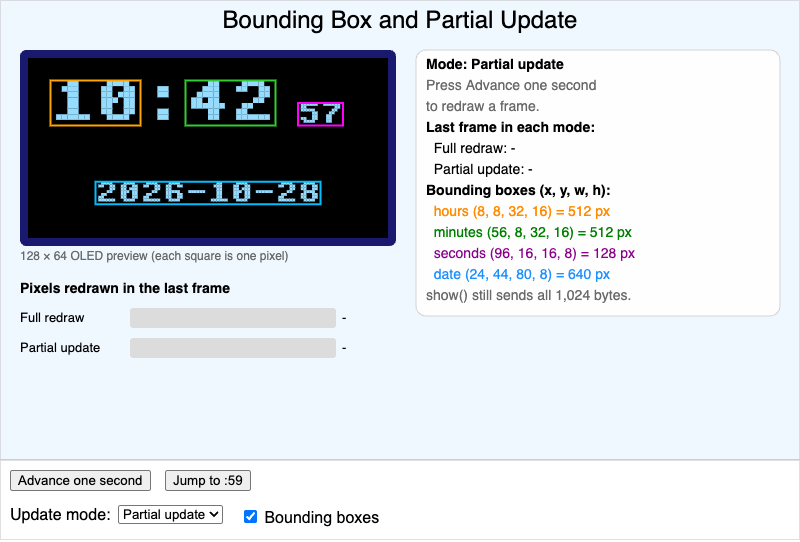
Compare a full redraw with a partial update on an OLED clock by counting the pixels each one redraws when the seconds change.
-
Breadboard Connectivity Explorer
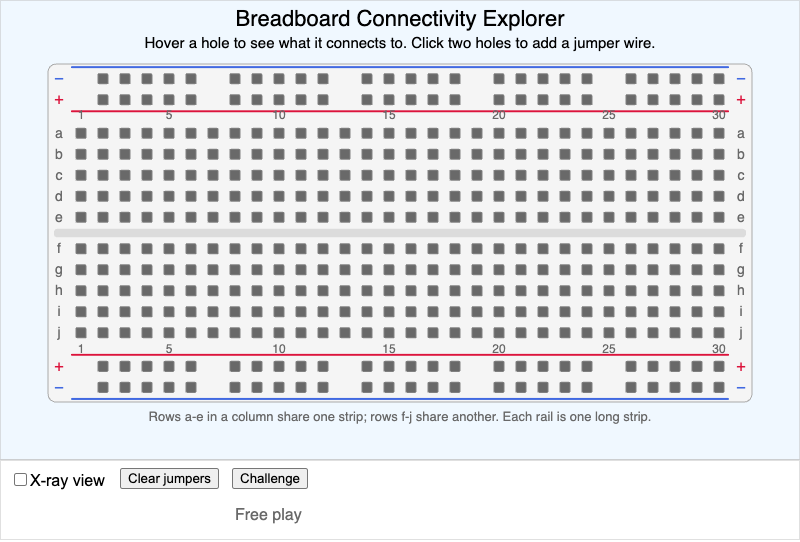
Hover over any hole of a half-size breadboard to light up every hole it is connected to, add jumper wires, peek at the hidden metal strips with X-ray view, and test yourself in Challenge mode.
-
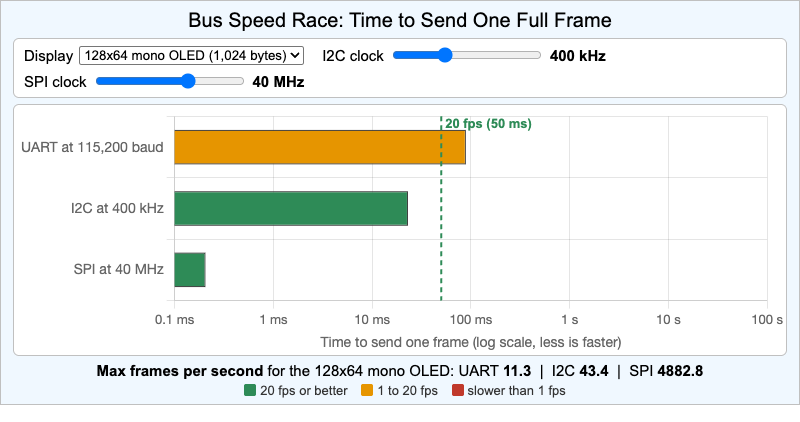
Compare how long UART, I2C and SPI take to send one full screen of pixels to three different displays, on a logarithmic time axis.
-
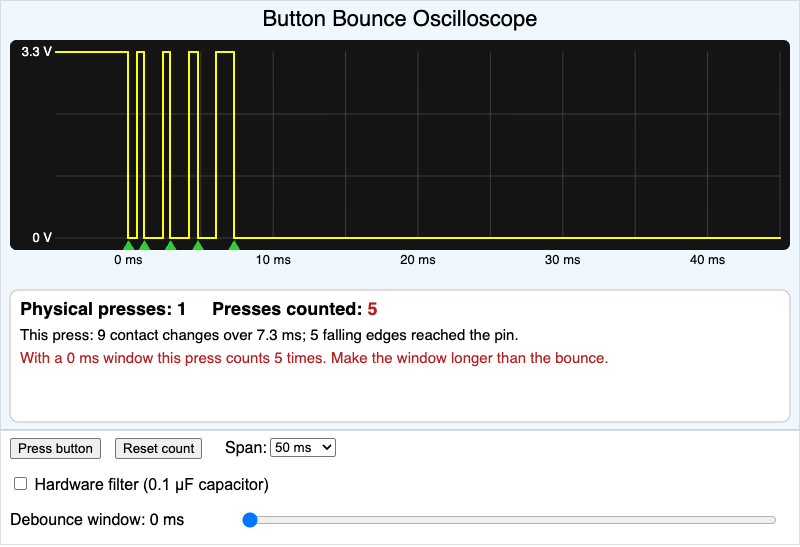
A single-shot oscilloscope captures contact bounce on every press; adjust the debounce window and a 0.1 uF hardware filter until one press counts once.
-
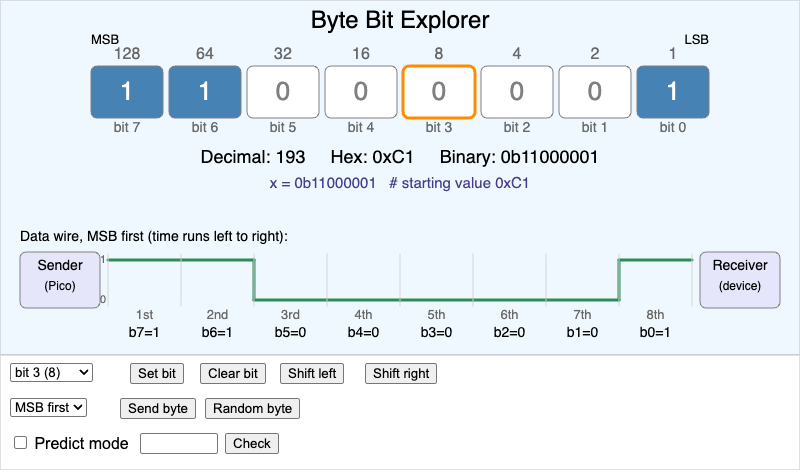
Toggle the eight bits of a byte, apply set, clear and shift operations, predict the result, and watch the byte go onto a wire MSB-first or LSB-first.
-
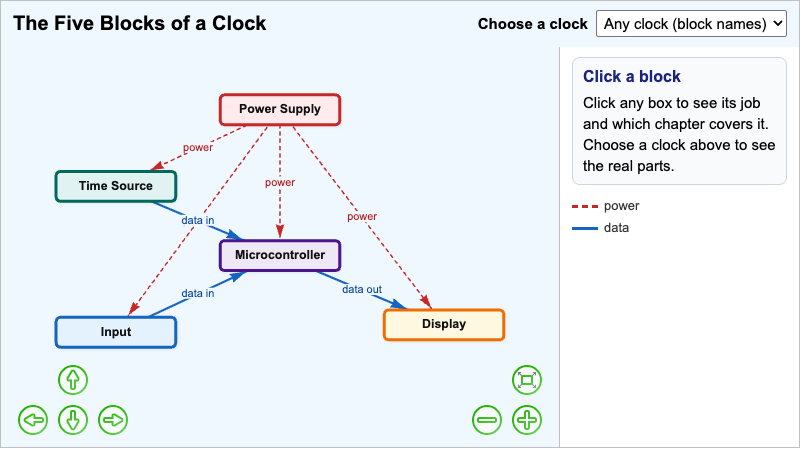
A block diagram of the five parts every clock needs (power supply, microcontroller, time source, display, and input) that relabels each block with real parts for three different clocks.
-
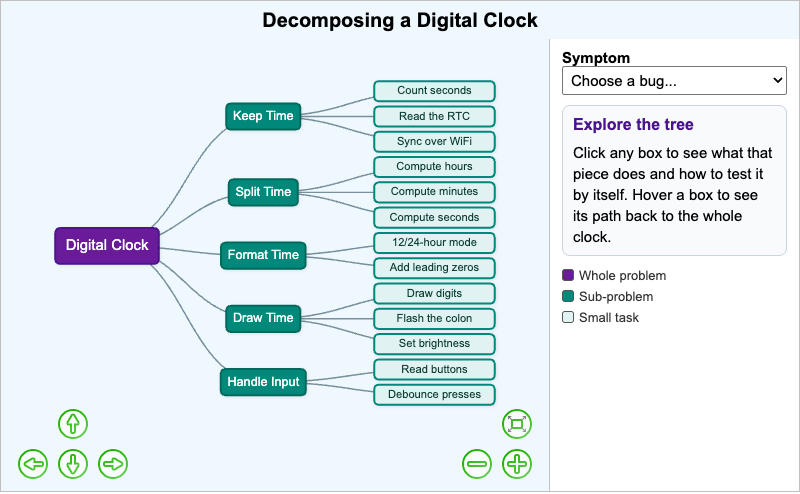
Explore a tree that breaks a digital clock into five sub-problems and thirteen small tasks, then pick a bug symptom and see which task is the most likely suspect.
-
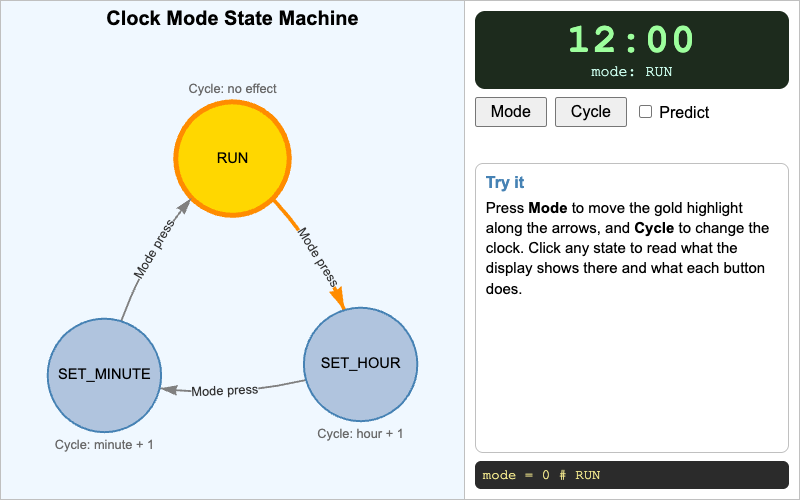
A three-state clock (RUN, SET_HOUR, SET_MINUTE) driven by Mode and Cycle buttons, with a mock display, clickable state descriptions and a predict-the-next-state mode.
-
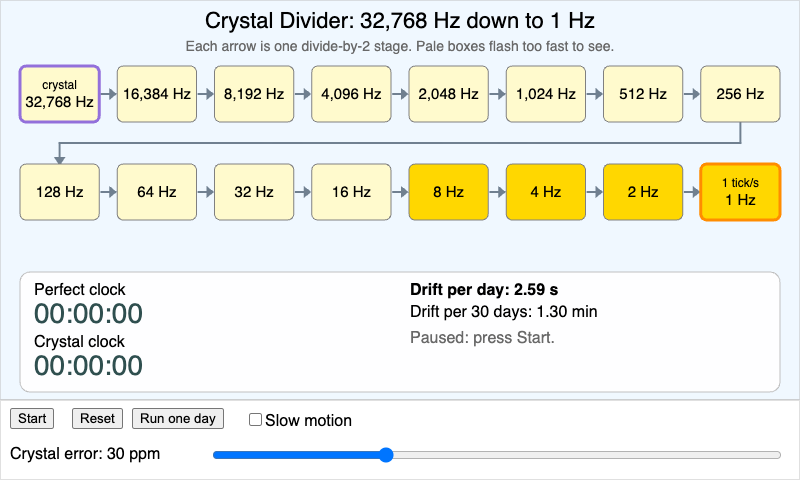
Watch a 32,768 Hz quartz crystal get divided by two fifteen times into a 1 Hz tick, then see how a parts-per-million error makes a clock drift each day.
-
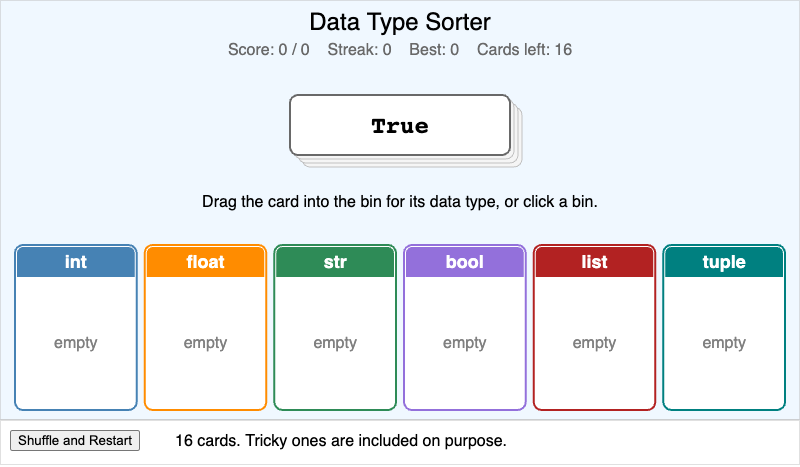
Drag Python value cards such as 3.0, "42" and (2026, 9, 28) into bins for int, float, str, bool, list and tuple, with hints for wrong answers.
-
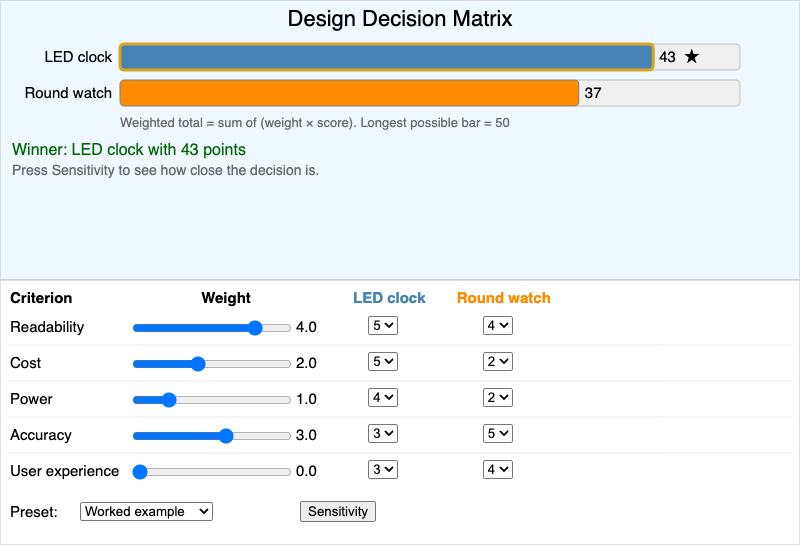
Weight criteria and score up to four clock designs in a decision matrix, see the weighted totals and the winner, and test how sensitive the choice is to each weight.
-
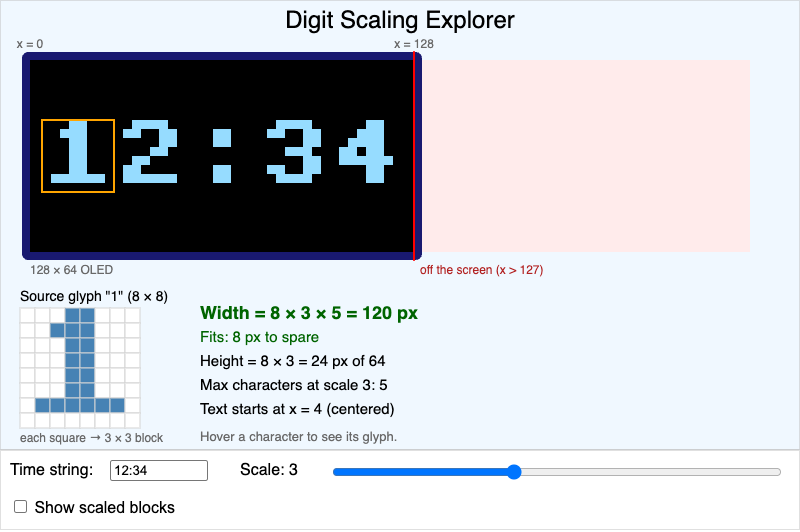
Scale an 8 by 8 font up to 6 times on a 128 by 64 OLED preview and see when the text becomes too wide for the screen.
-
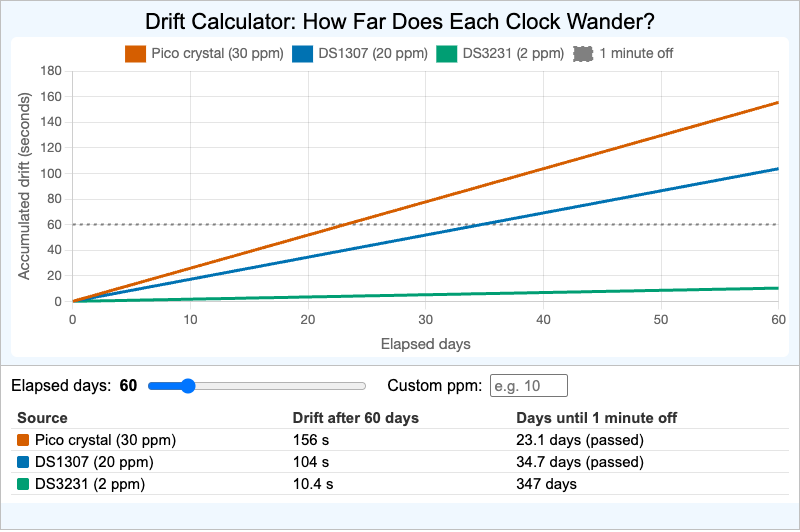
A Chart.js line chart of accumulated drift versus days for a Pico crystal, a DS1307, a DS3231, and a custom ppm value, with the days until each clock is one minute off.
-
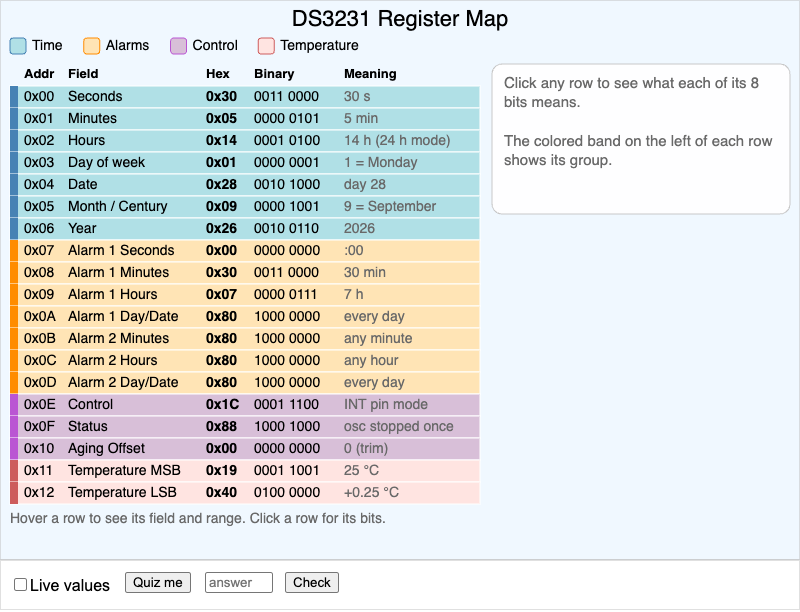
An interactive map of the DS3231 real-time clock registers 0x00 to 0x12 showing each byte in hex, binary, and decoded form, with bit-field details, live BCD values, and a decoding quiz.
-
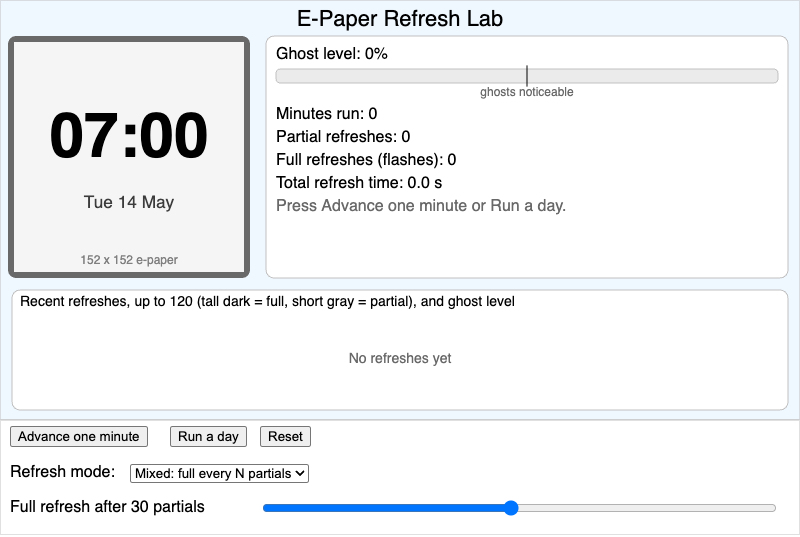
Compare always-full, always-partial and mixed refresh schedules on an e-paper clock, and watch the trade-off between refresh time, screen flashes and ghosting.
-
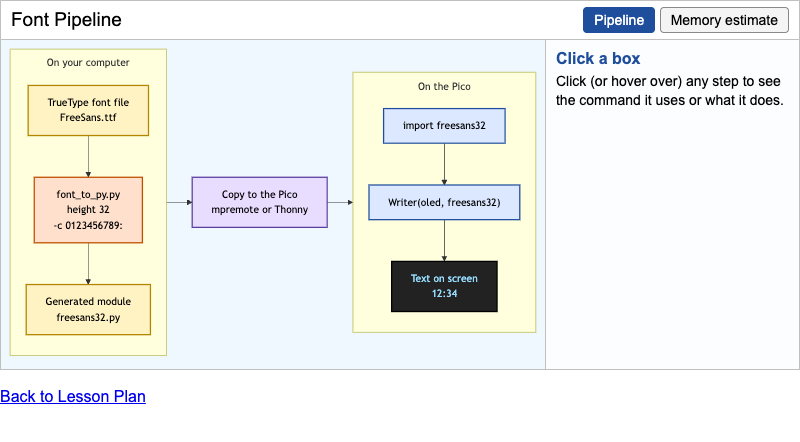
Follow the steps from a TrueType font on your computer to large text on the OLED, and estimate how much memory a font module needs.
-
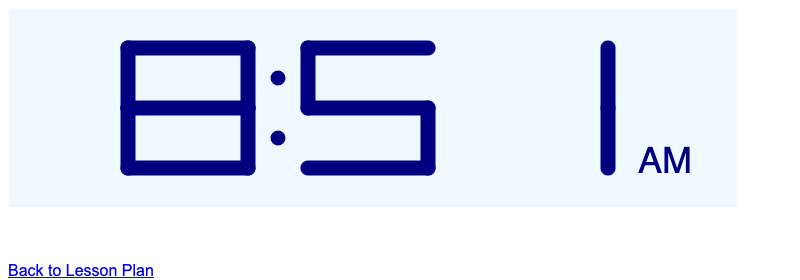
An interactive p5.js simulation displaying current time using four seven-segment digits with AM/PM indicator
-
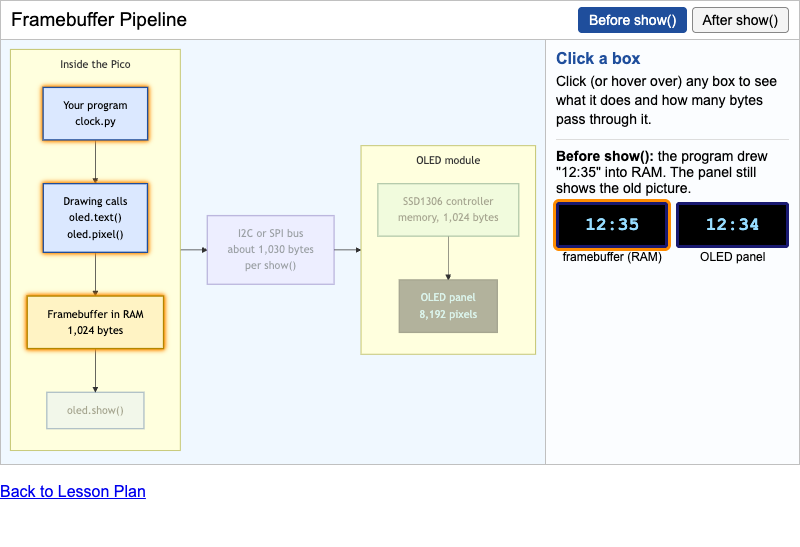
Follow the path from a drawing call to lit pixels on an OLED, and compare the state before and after show().
-
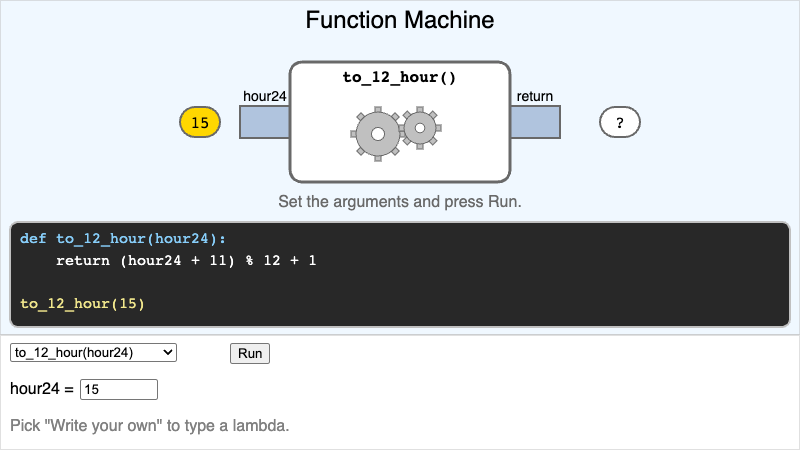
Functions drawn as machines: argument tokens enter chutes named after the parameters and the return value comes out, including a write-your-own lambda.
-
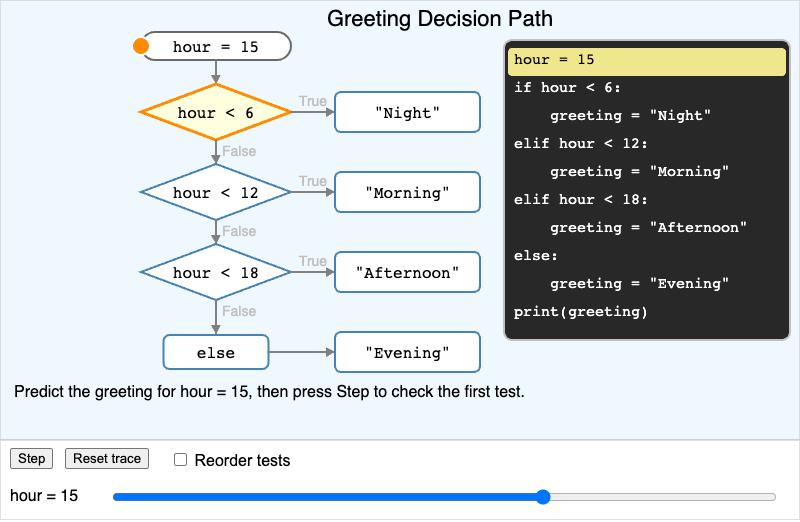
Trace an if/elif/else chain that picks a greeting from the hour, one test at a time, and see how reordering the tests changes the answer.
-
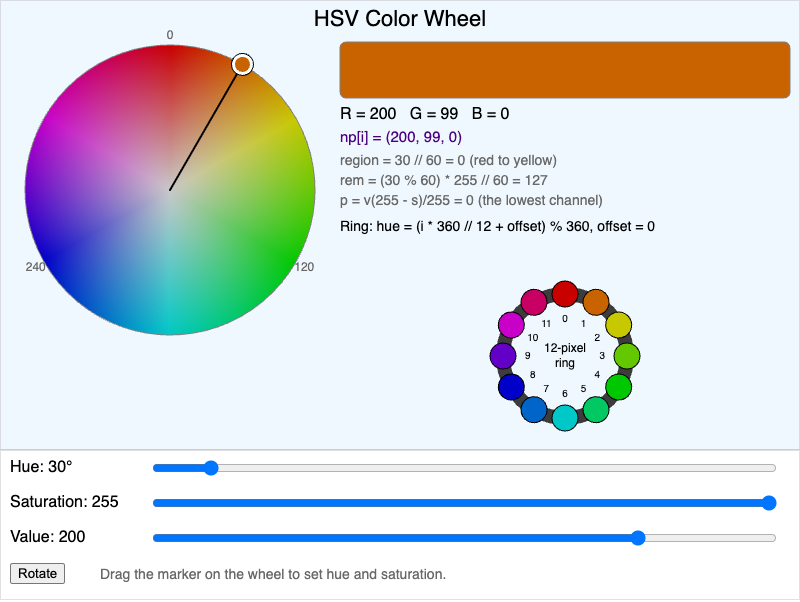
Explore hue, saturation, and value on a color wheel with a draggable marker, see the RGB values from the same integer hsv_to_rgb function used on the Pico, and watch a 12-pixel virtual NeoPixel ring show and rotate the rainbow.
-
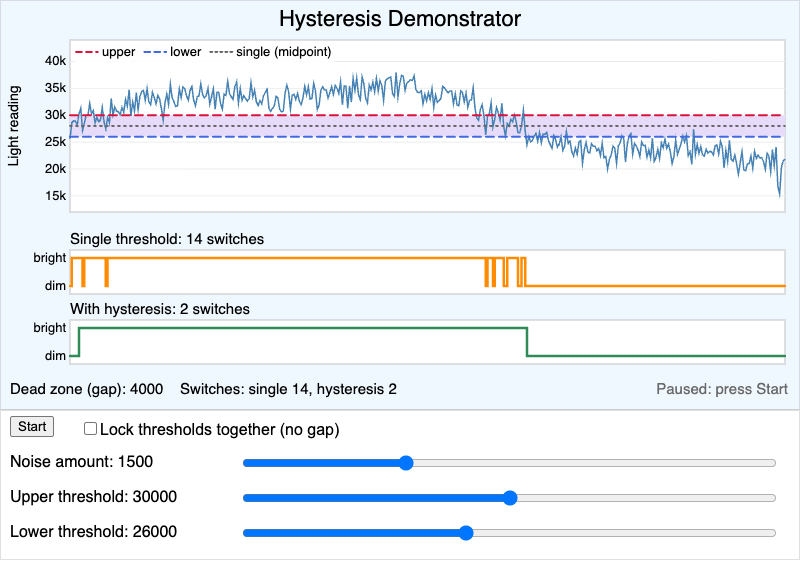
Compare a single threshold with a two-threshold dead zone on a noisy light reading, and count how often each output switches.
-
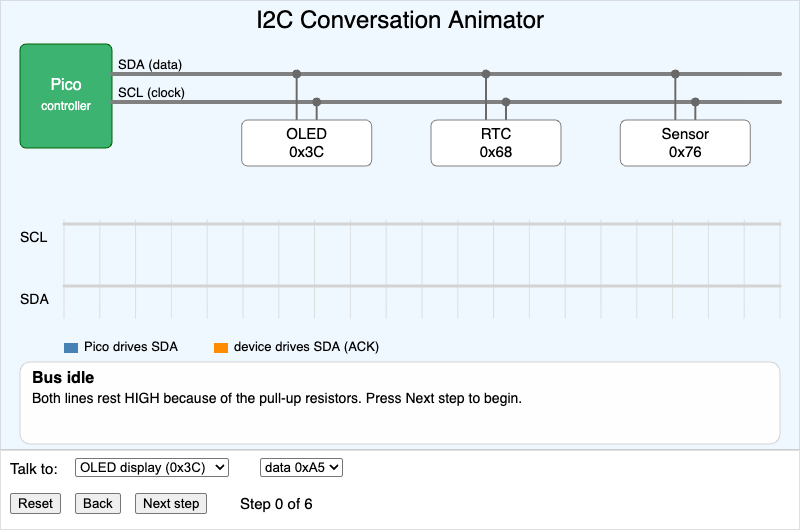
Step through one I2C write transaction - START, address and write bit, ACK, data byte, ACK, STOP - and see the SDA and SCL waveforms for each part.
-
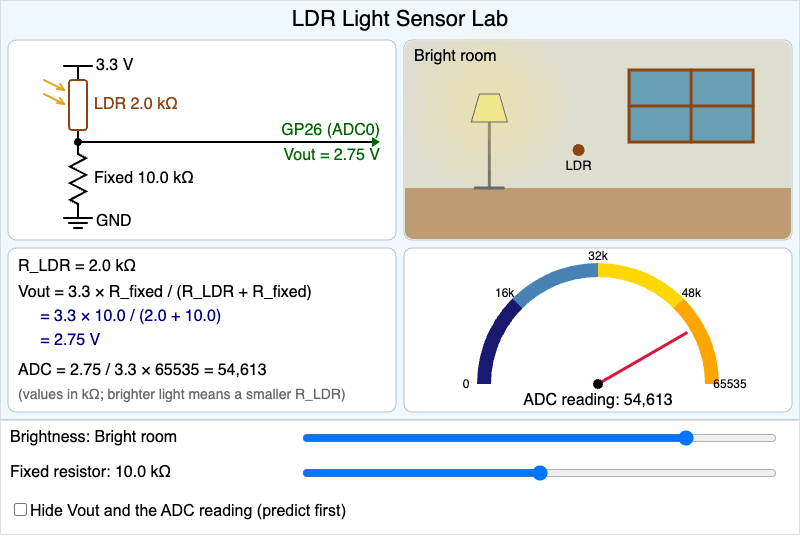
Use the voltage divider formula to predict the ADC reading of a light-dependent resistor as the room brightness and the fixed resistor change.
-
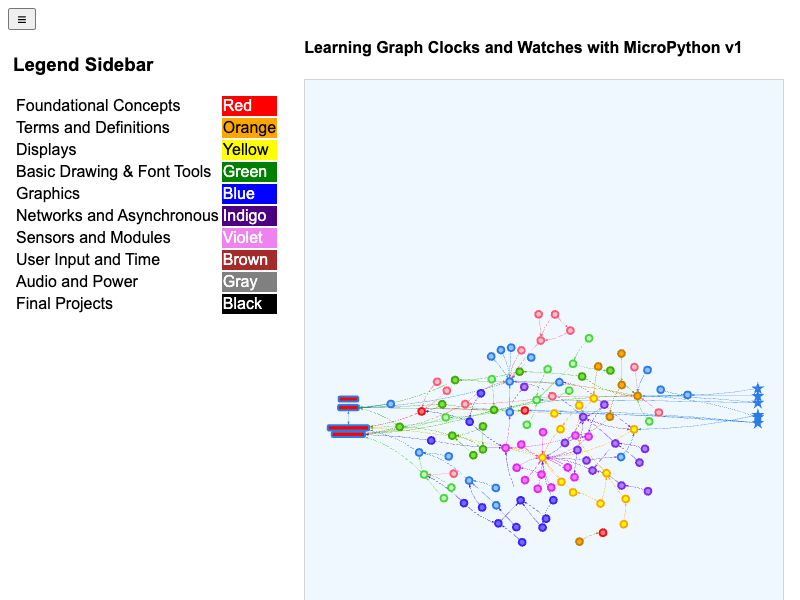
Interactive vis-network visualization of the learning graph for Clocks and Watches with MicroPython course concepts
-
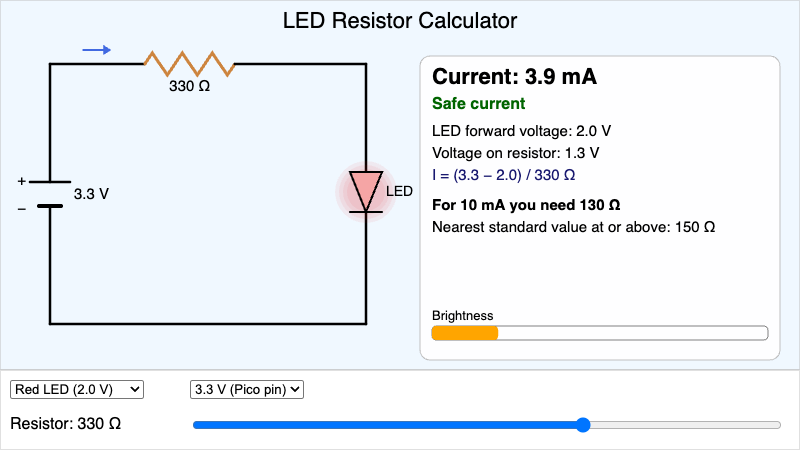
Choose an LED color, a 3.3 V or 5 V supply, and a standard resistor to see the LED current, its brightness, a warning above 20 mA, and the resistor you would need for 10 mA.
-
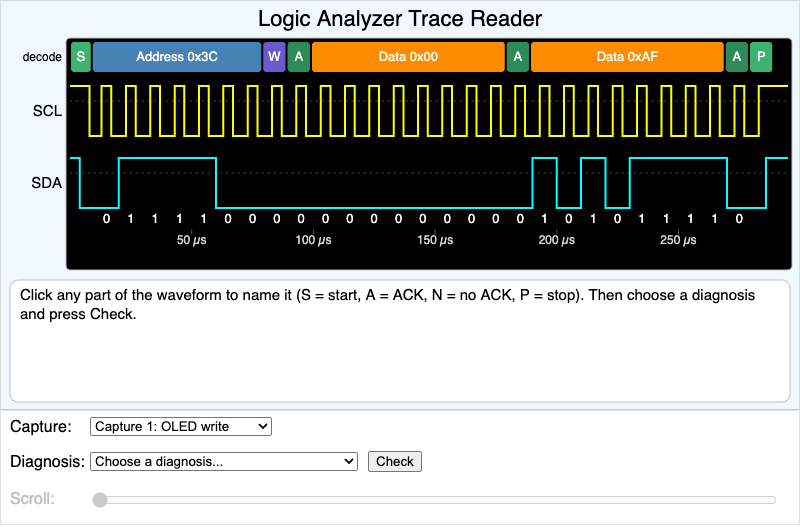
Read captured I2C and button waveforms on a logic analyzer, click each part to decode it, and diagnose a missing acknowledgment, weak pull-ups or contact bounce.
-
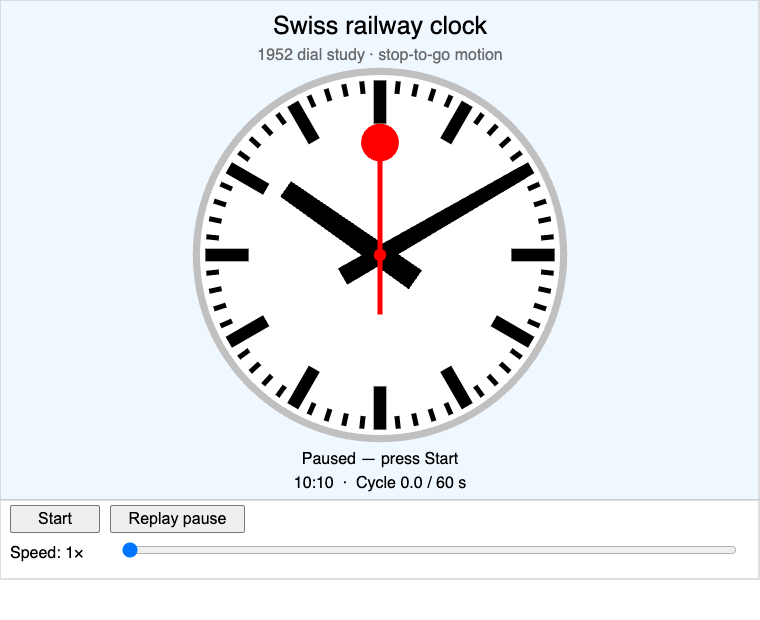
Explore a watch face inspired by the 1952 SBB/Moser-Baer dial standard. Watch the seconds hand glide around in 58 seconds, pause at twelve, and wait while the minute and hour hands advance. Adjust playback speed or replay the pause to inspect the sequence.
-
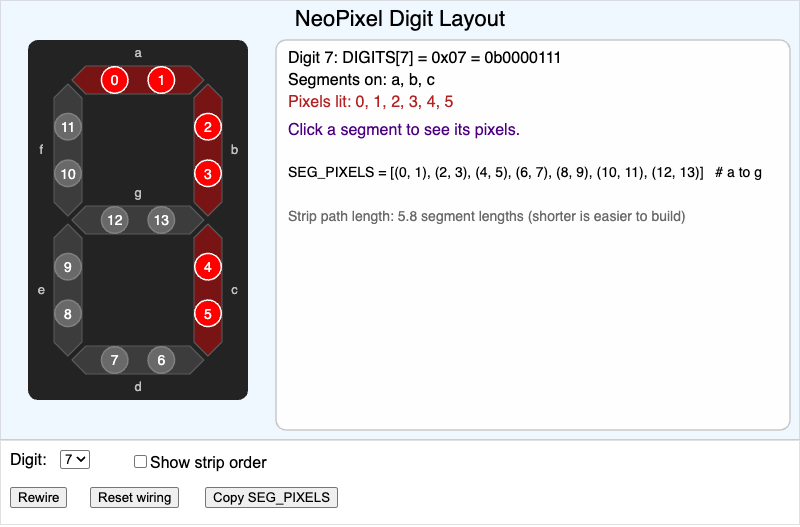
A seven-segment digit built from a 14-pixel NeoPixel strip. Click segments to see their pixels, choose a digit to see which pixels light, show the strip's path, design your own wiring order, and copy it as a Python SEG_PIXELS list.
-
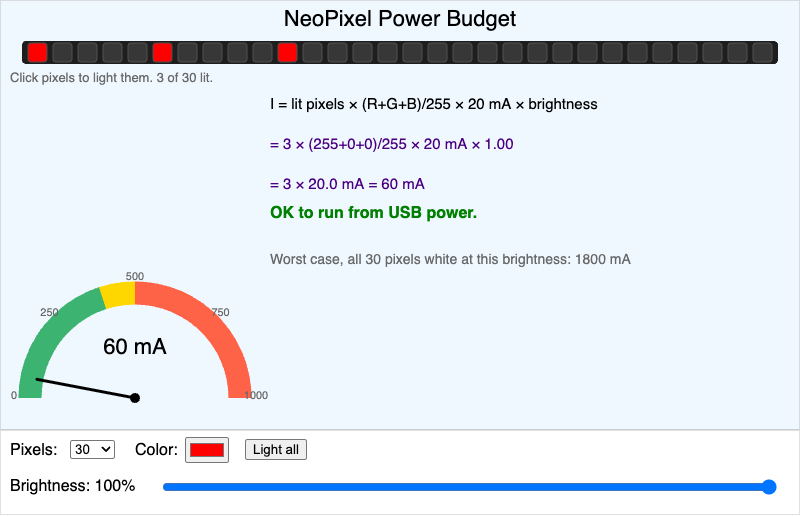
Light pixels on a virtual NeoPixel strip, choose the color, length, and brightness, and watch a gauge compare the total current with the 500 mA USB limit, with the power formula shown with the numbers filled in.
-
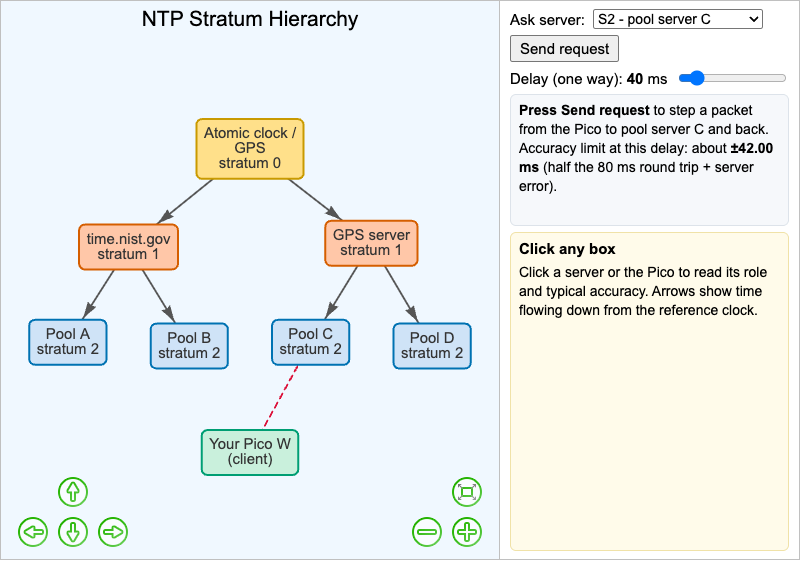
A vis-network tree showing how time flows from atomic clocks through stratum 1 and stratum 2 NTP servers to a Pico W, with a step-by-step request and reply that shows the four NTP timestamps and how network delay limits accuracy.
-
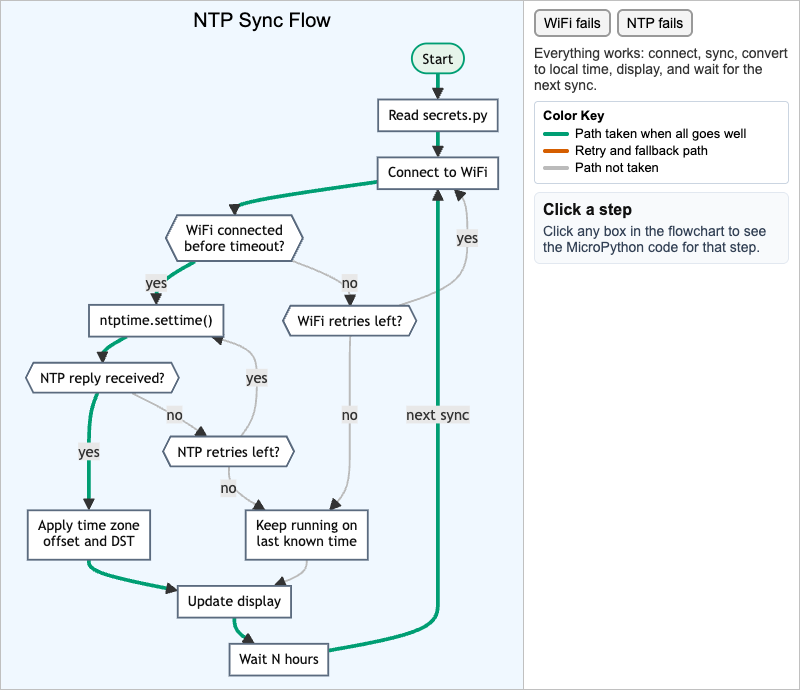
A Mermaid flowchart of a Pico W time sync, from reading secrets.py to waiting for the next sync, with clickable steps that show their MicroPython code and toggles that light up the WiFi and NTP retry paths.
-
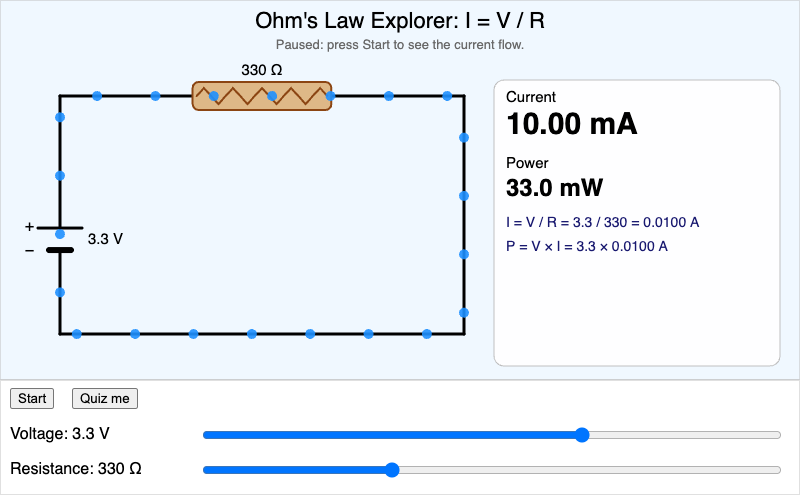
Change the voltage and resistance of a simple loop circuit to see Ohm's Law at work: live current and power readouts, moving dots that speed up with current, and a quiz that asks you to calculate the current.
-
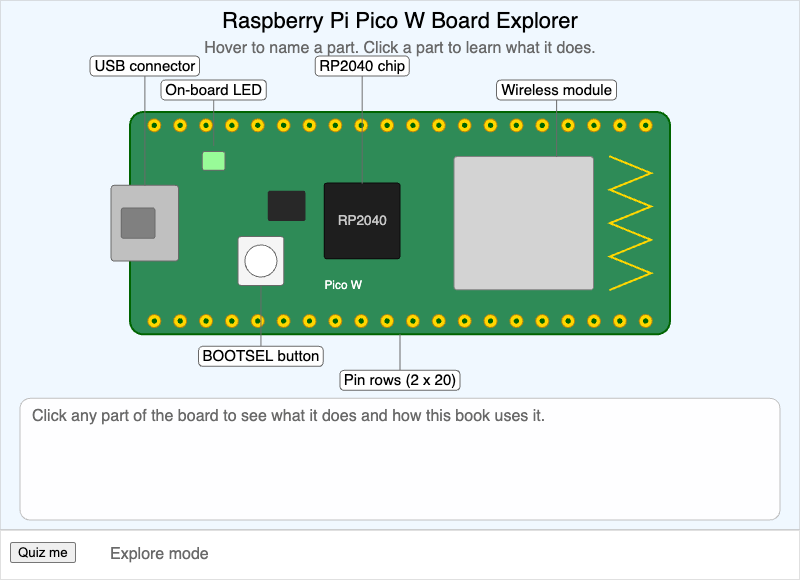
Hover and click the main parts of a Raspberry Pi Pico W drawing to learn what each one does, then take a quiz that hides the labels and tracks the parts you missed.
-
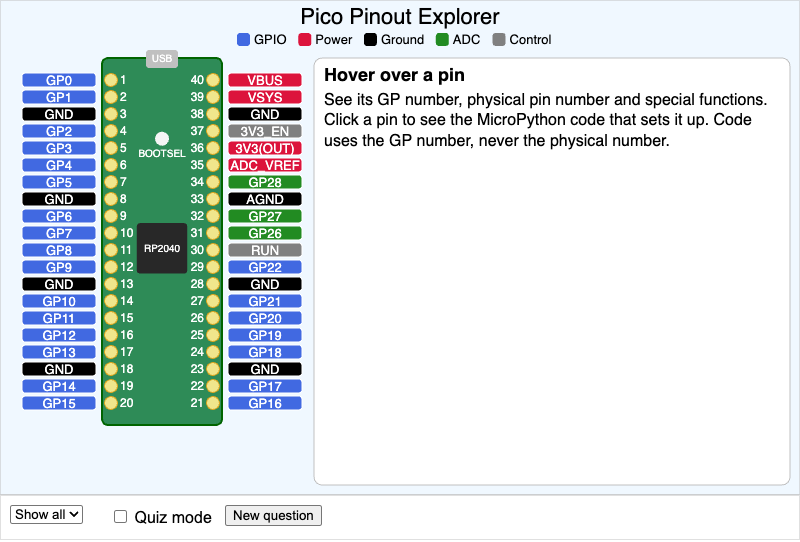
An interactive Raspberry Pi Pico pinout: hover a pin for its GP number, physical number and functions, click it for MicroPython code, filter by bus, and quiz yourself.
-
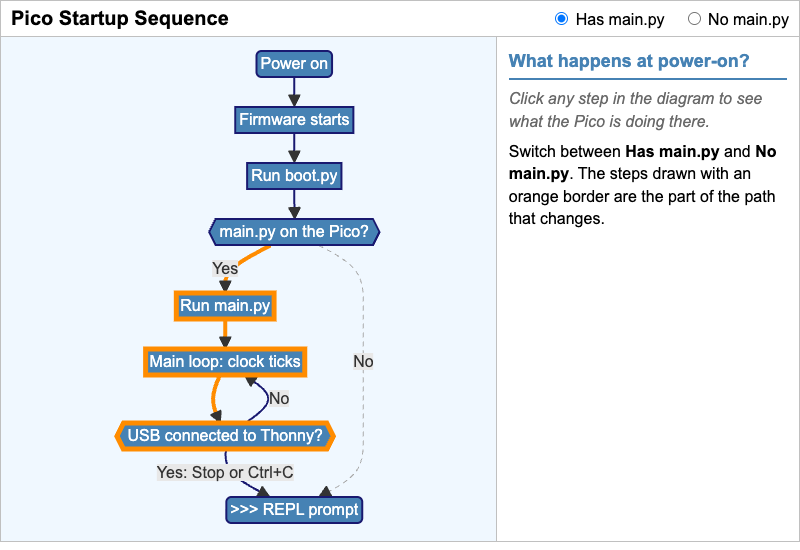
A clickable flowchart of what the Pico does from power-on to a running clock, with a toggle that shows how the path changes when main.py is missing.
-
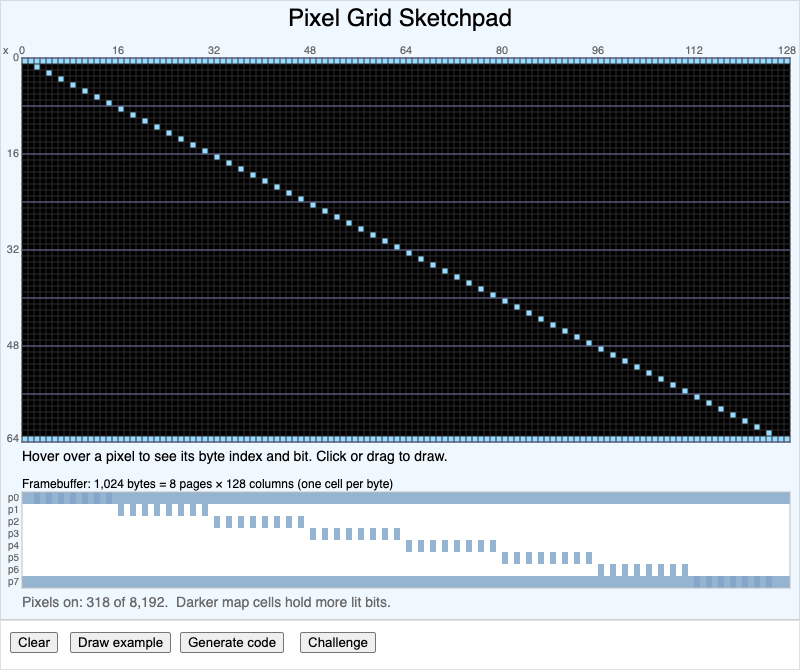
Draw on a 128 by 64 OLED pixel grid and see which of the 1,024 framebuffer bytes and which bit stores each pixel.
-
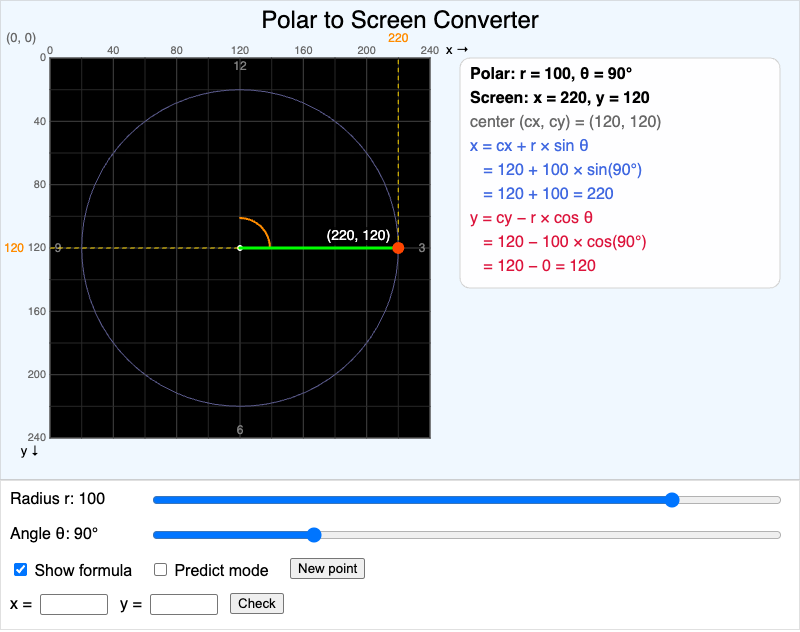
Convert a radius and a clockwise clock angle into pixel coordinates on a 240 by 240 screen, and practice predicting x and y.
-
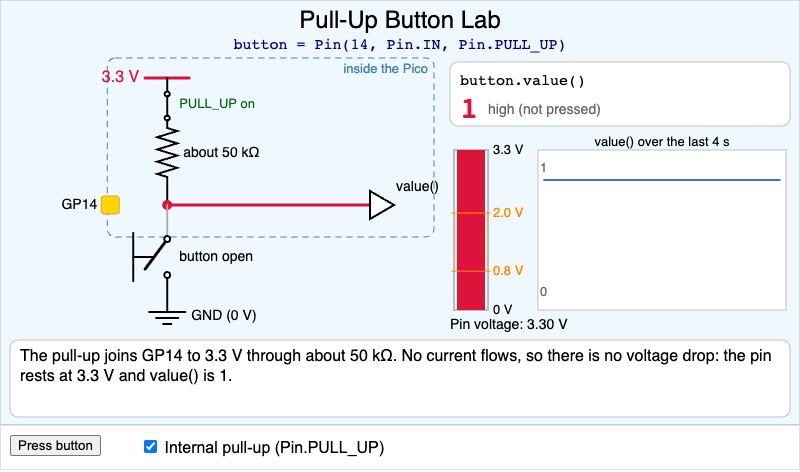
A GP14 button circuit with the internal pull-up resistor: toggle the button and the pull-up to see the pin voltage, value() and a floating input.
-
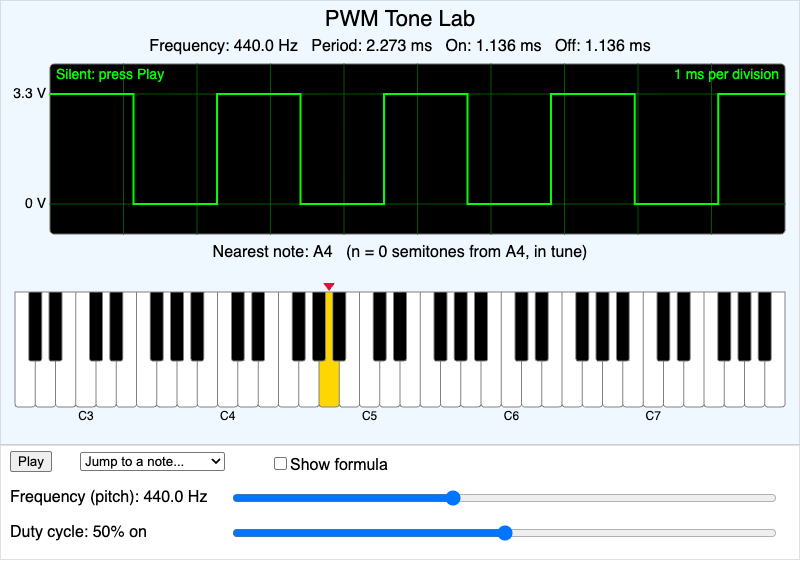
Change the frequency and duty cycle of a PWM square wave, see it on an oscilloscope and a piano keyboard, and hear it through the browser.
-
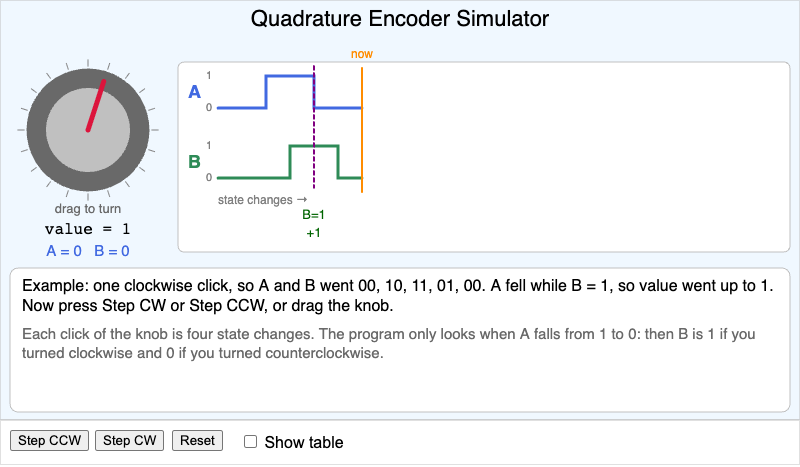
Turn a rotary encoder knob one step at a time and watch the A and B signals, with each falling edge of A marked by the value of B that sets the direction.
-
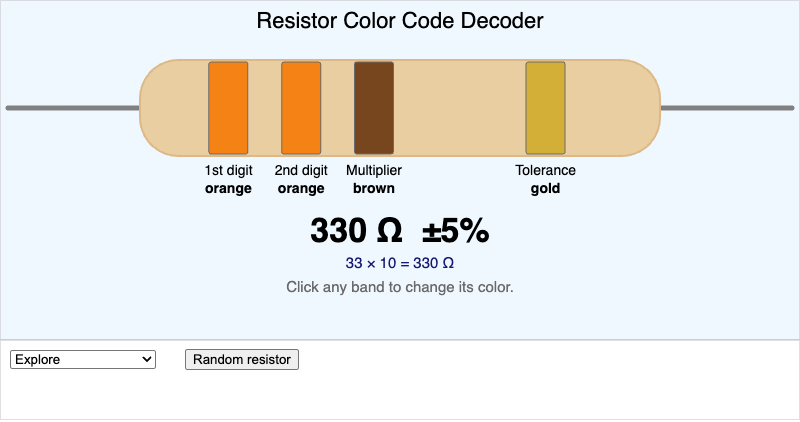
Click the bands of a large four-band resistor to change their colors and read its value, then quiz yourself by reading random resistors or setting the bands to match a value.
-
Resolution and Memory Calculator
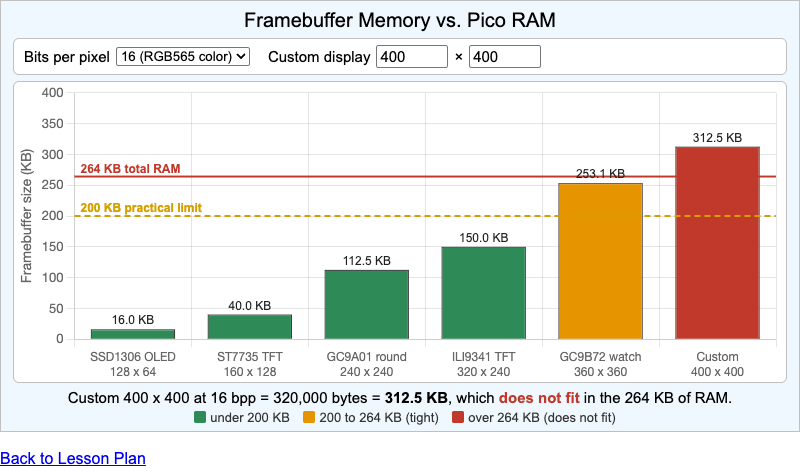
Calculate the framebuffer size of five displays and a custom one, and judge whether each fits in the Pico's 264 KB of RAM.
-
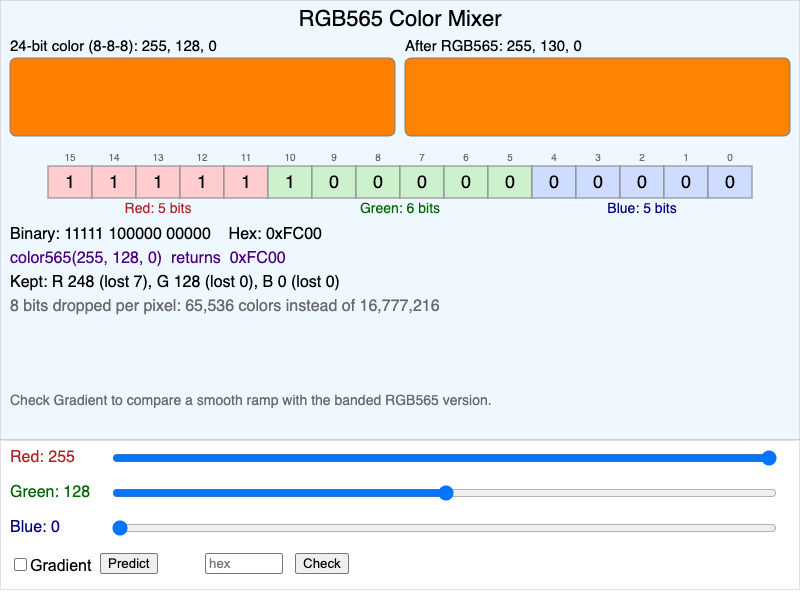
Mix a color with red, green, and blue sliders and see it packed into the 16-bit RGB565 format, with the 5-6-5 bit groups, the hex value, the color565() call, the detail lost, and the banding in a gradient.
-
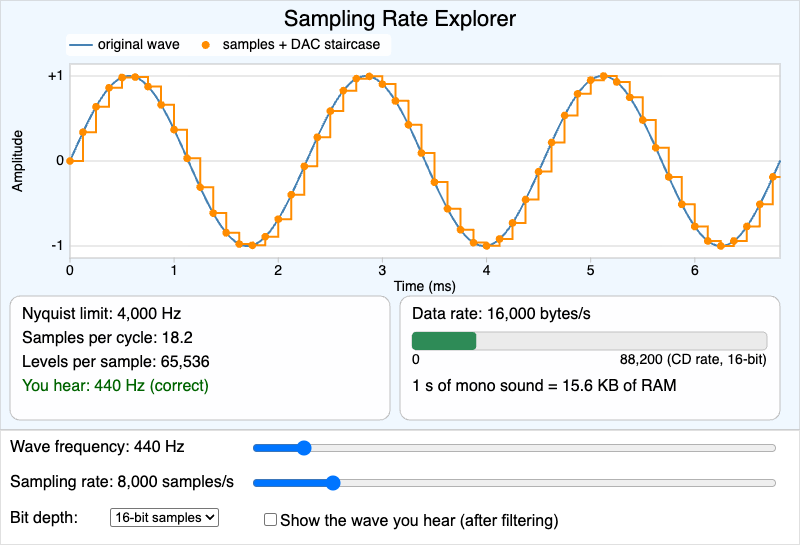
Sample a sine wave at different rates and bit depths to see the Nyquist limit, aliasing, and the bytes per second each choice costs.
-
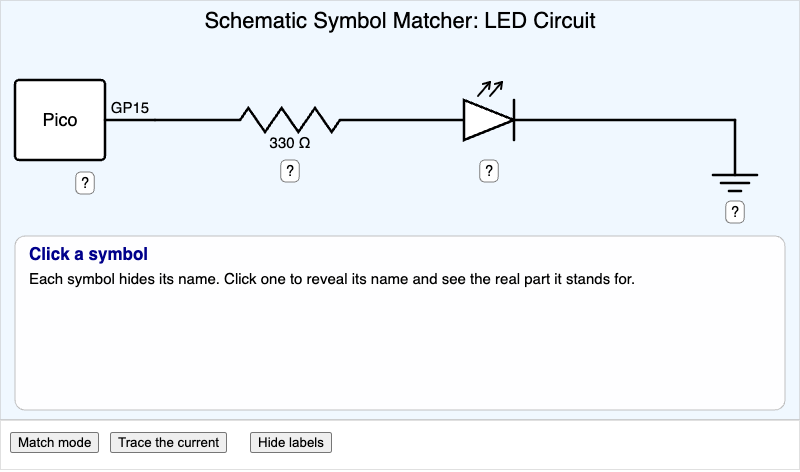
Click the hidden symbols in an LED circuit schematic to reveal each part, match drawings of real parts to their symbols, and trace the current from pin GP15 to ground.
-
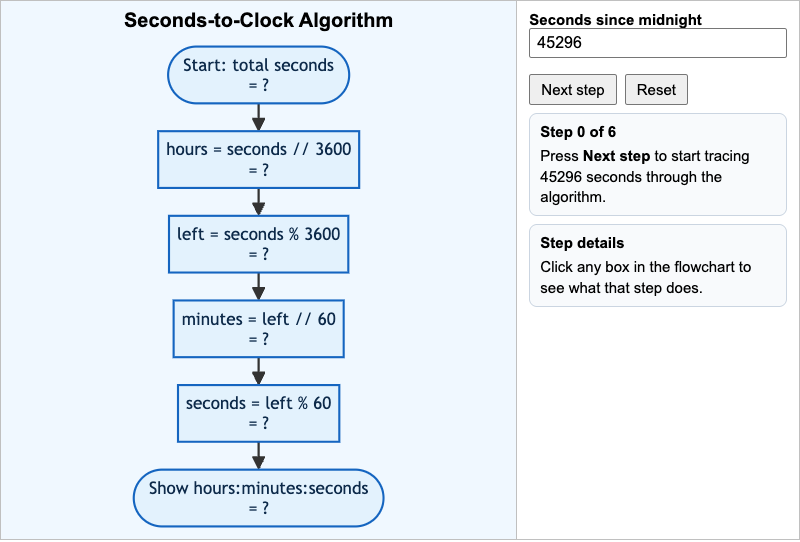
Step a number of seconds since midnight through a six-box flowchart that uses whole-number division and remainders to produce an hours:minutes:seconds clock reading.
-
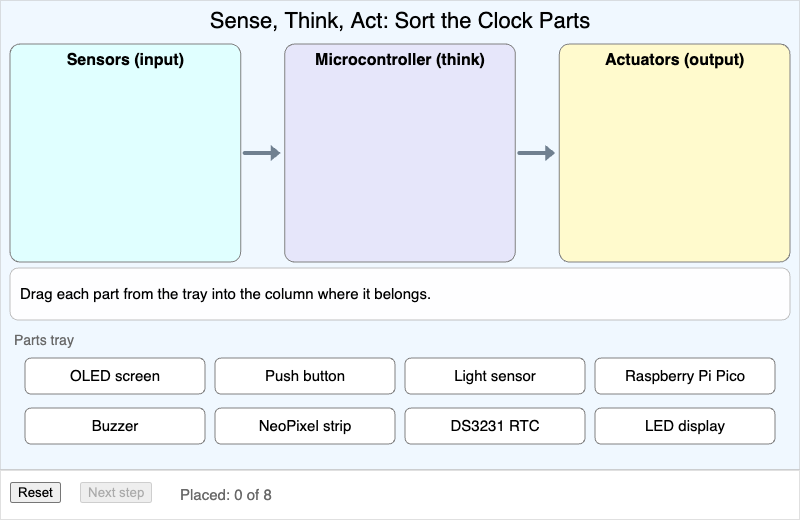
Drag eight clock parts into Sensors, Microcontroller, and Actuators columns, get a hint for every wrong drop, then step one signal through the sense-think-act loop.
-
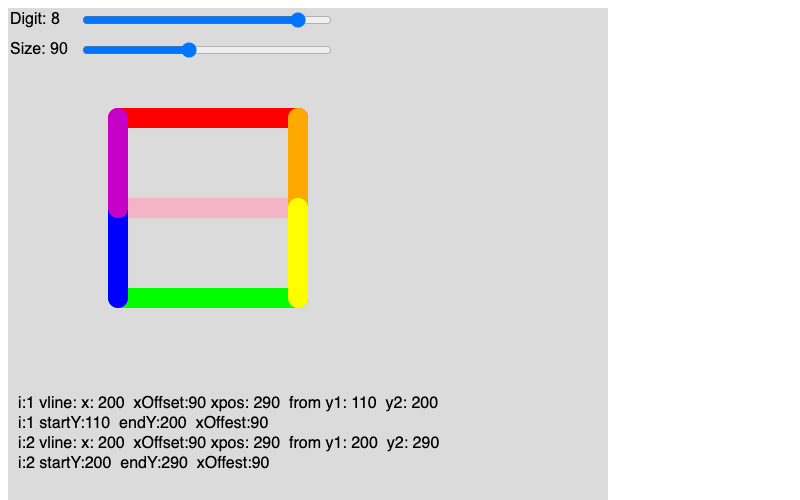
Interactive p5.js simulation demonstrating how seven-segment displays work with individual segment control
-
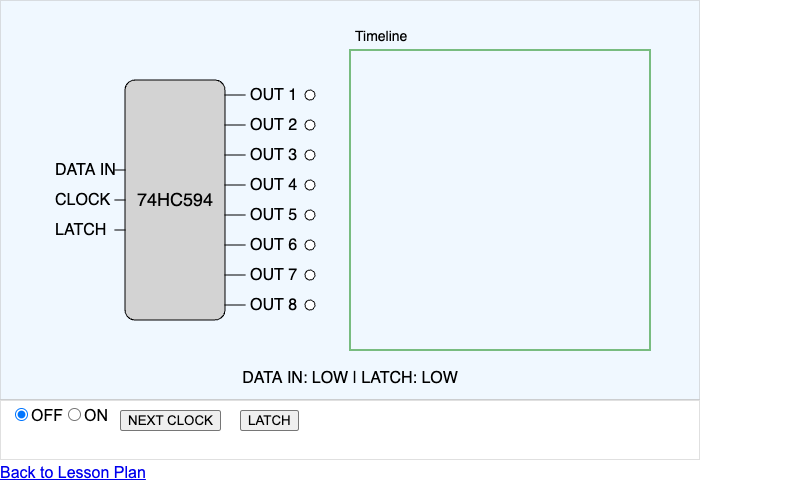
Interactive p5.js simulation of a 74HC594 shift register demonstrating serial-to-parallel data conversion
-
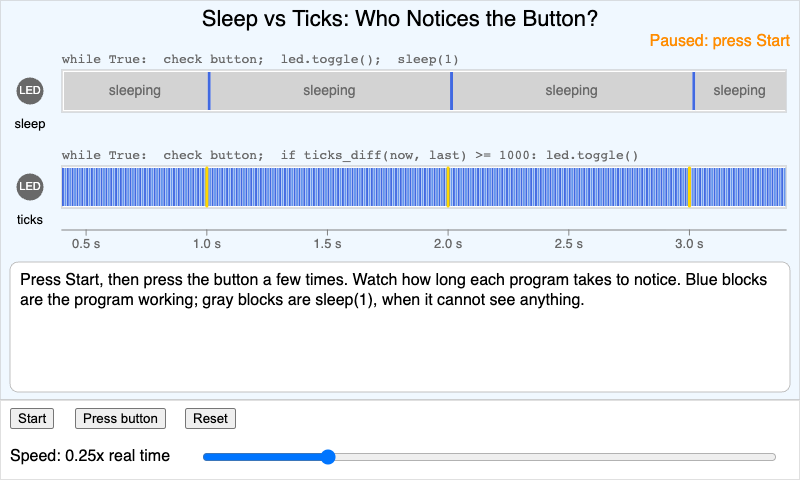
Two timelines compare a blocking sleep(1) loop with a non-blocking ticks_diff() loop and measure how long each takes to notice a button press.
-
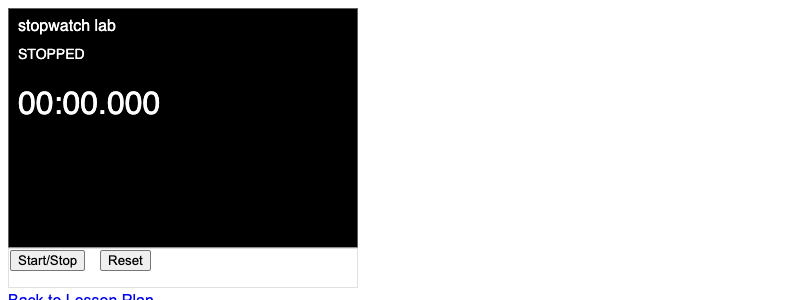
Interactive p5.js stopwatch simulation with start/stop and reset controls, displaying time in MM:SS.mmm format
-
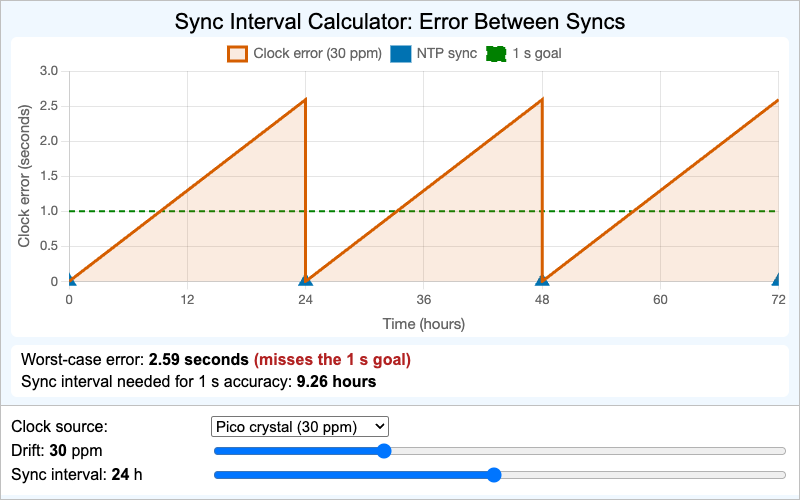
A Chart.js sawtooth chart of clock error over three days that grows between NTP syncs and drops to zero at each sync, with sliders for drift and sync interval.
-
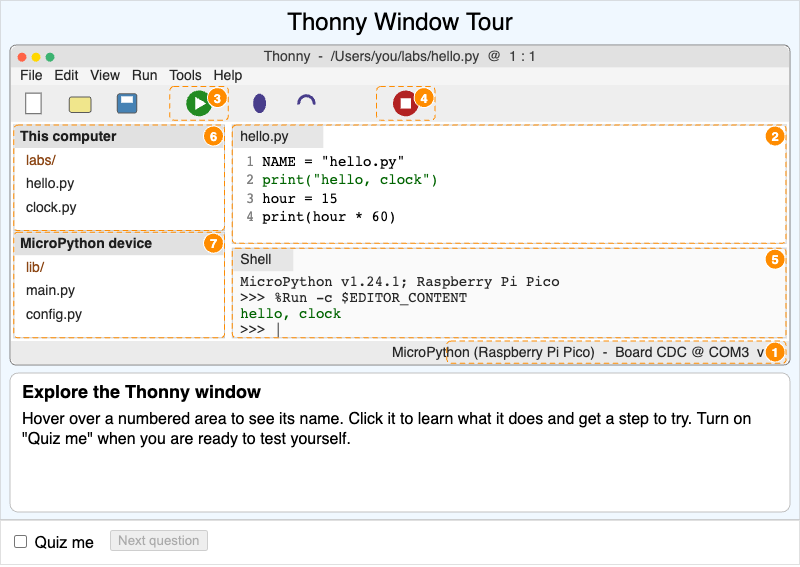
A clickable mockup of the Thonny IDE with numbered hotspots for the interpreter selector, editor, Run and Stop buttons, Shell, and the two Files panes, plus a quiz mode.
-
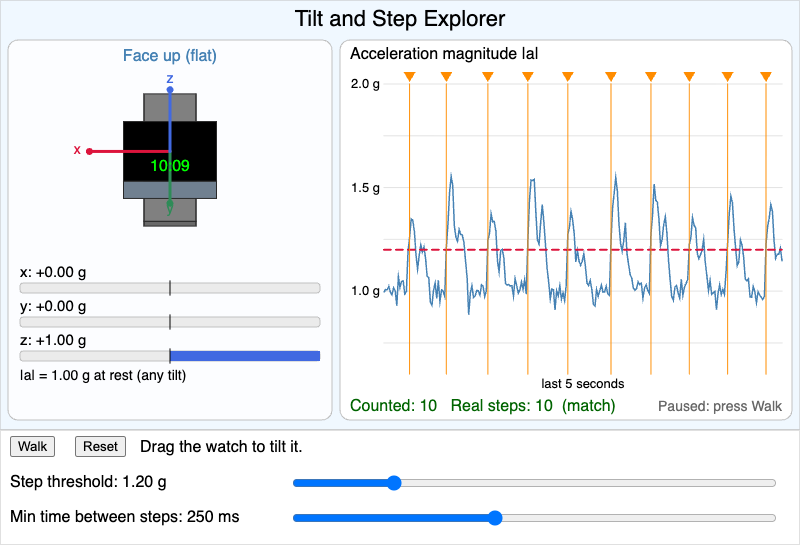
Drag a 3D watch to see gravity move between the accelerometer's x, y and z axes, then tune a step counter's threshold and minimum time between steps on a simulated walk.
-
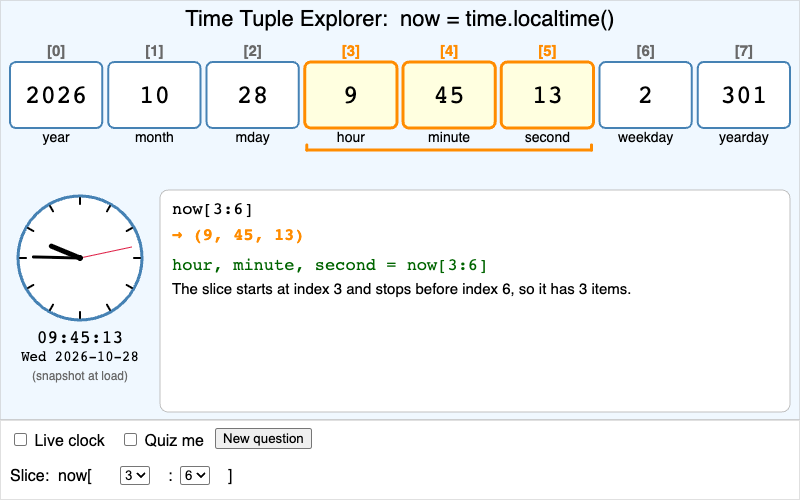
The eight fields of time.localtime() as labeled boxes filled from your clock: click for an index, drag for a slice like now[3:6], or quiz yourself on the field order.
-
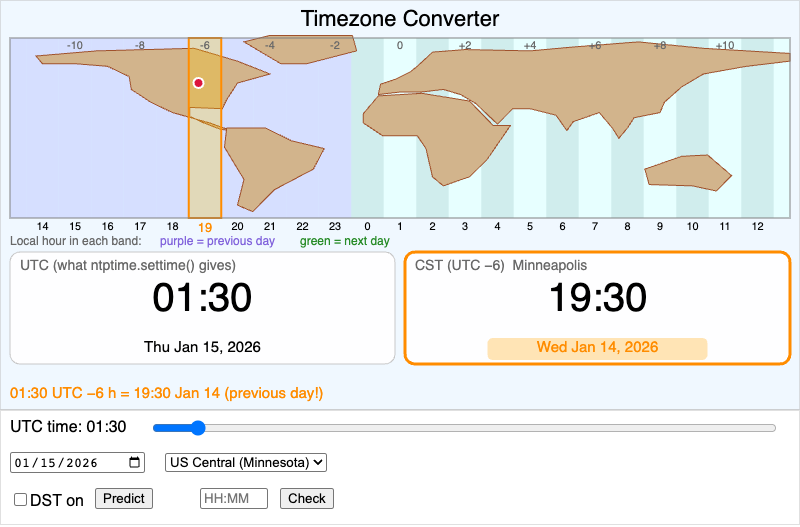
Convert UTC to local time for seven time zones using integer second arithmetic, with a world map of time-zone bands, a DST toggle, highlighted date rollovers, and a Predict mode.
-
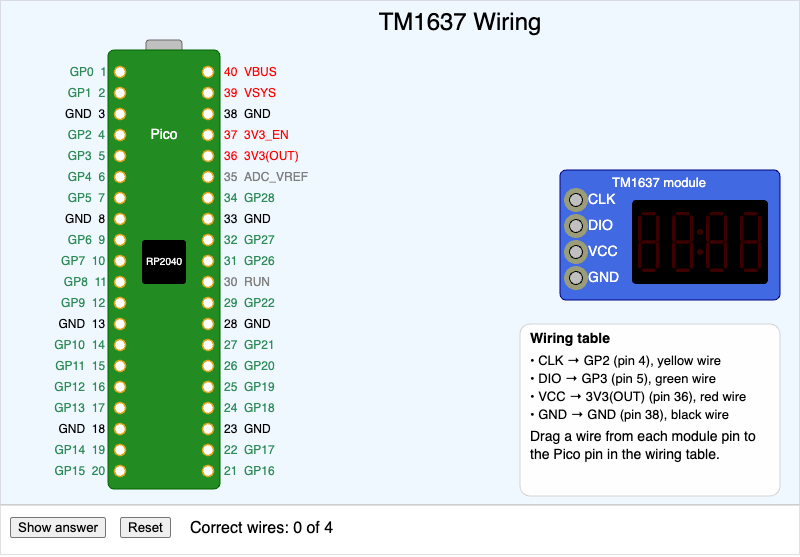
Connect the four pins of a TM1637 display module to the correct Raspberry Pi Pico pins; correct wires lock in and the display lights up 12:34.
-
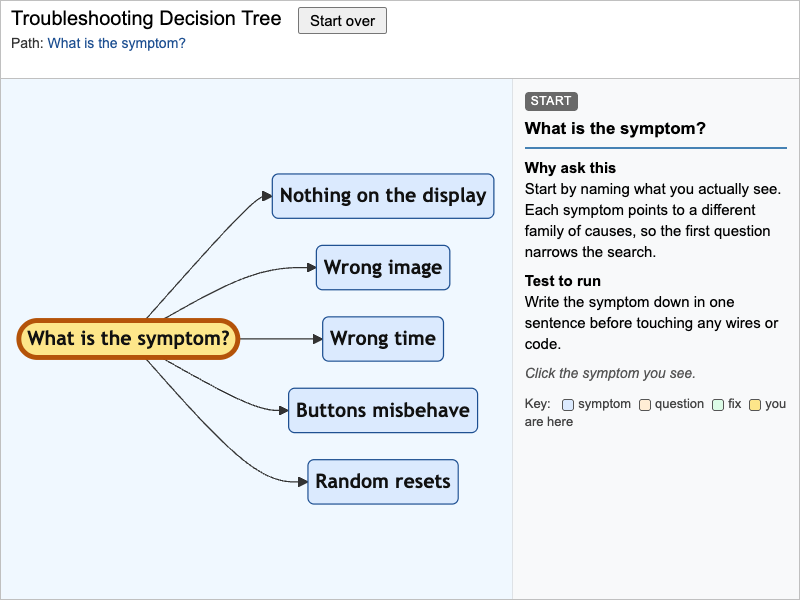
Walk a clickable troubleshooting tree for Pico clocks: pick a symptom, answer yes or no questions, and reach a likely cause, the test to run and the chapter to review.
-
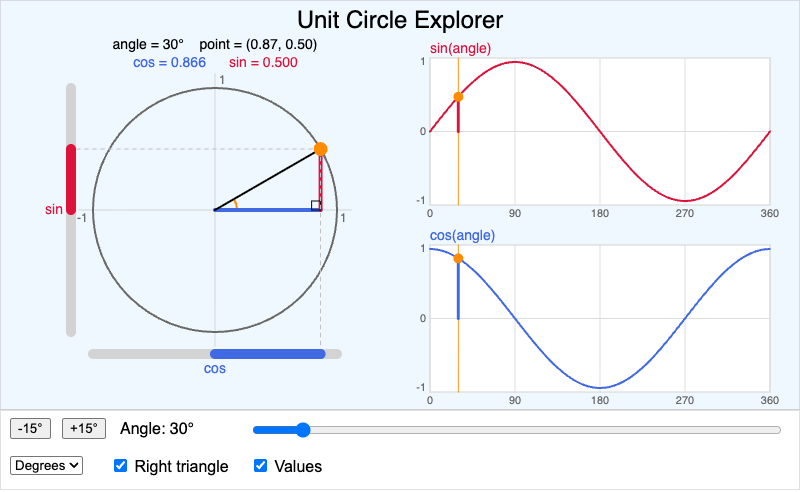
See sine and cosine as the vertical and horizontal parts of a point on a circle of radius 1, with matching bars and graphs.
-
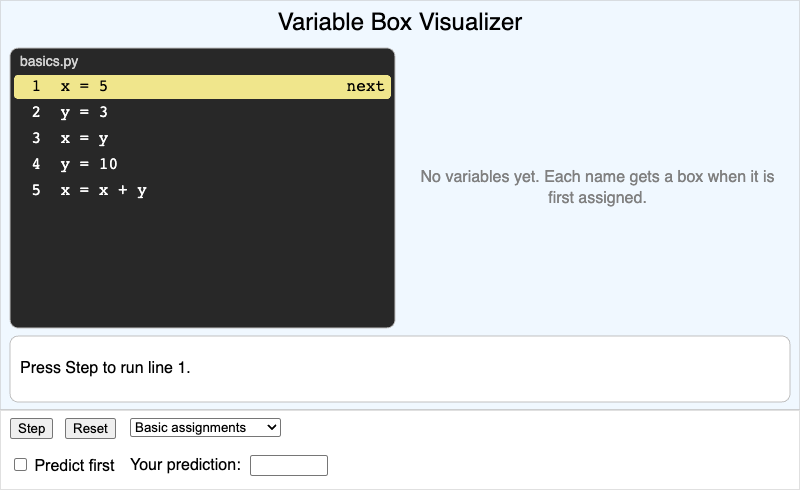
Step through short Python programs one assignment at a time and predict each variable's new value before the line runs.
-
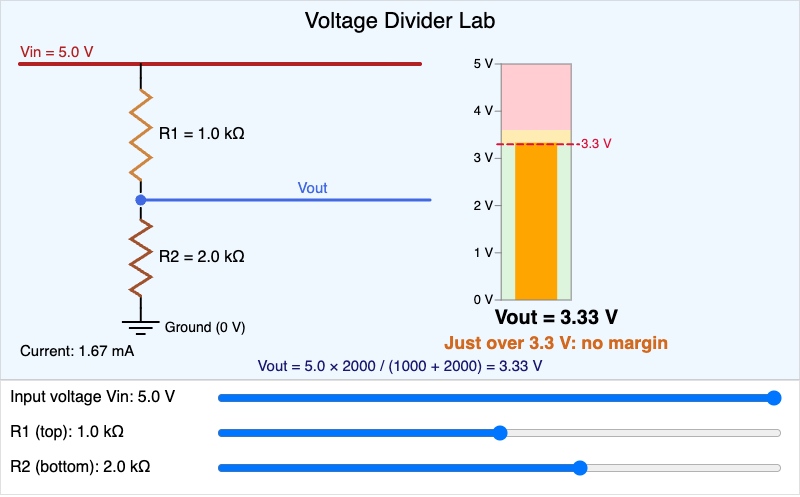
Adjust the input voltage and two resistors of a voltage divider, watch a bar-graph voltmeter show the output, and judge whether it is safe for a 3.3 V Pico pin.
-
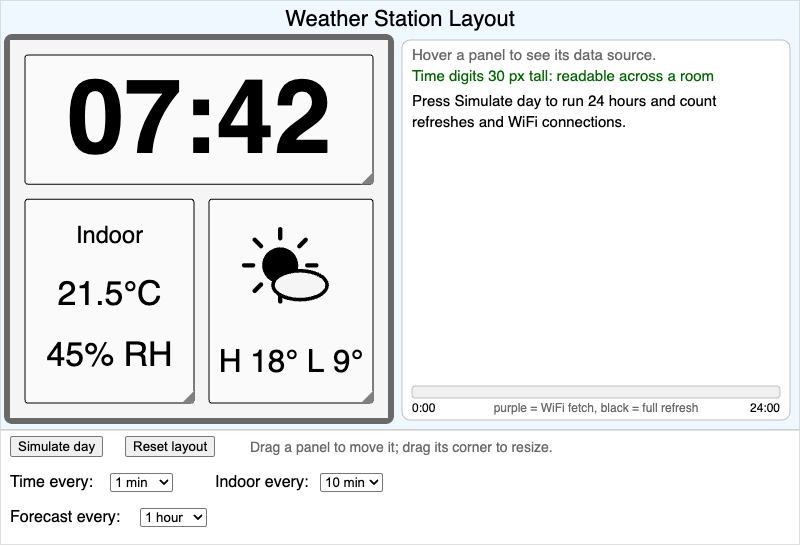
Design a 152 by 152 pixel e-paper weather display by dragging and resizing panels, choose each panel's update schedule, and simulate a day to count refreshes, WiFi connections and battery life.
-
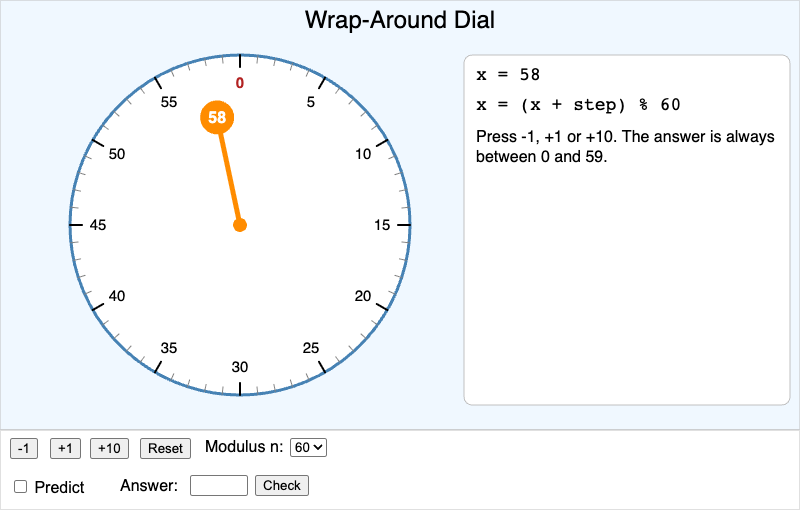
A clock-style dial for 12, 24 or 60 positions shows (x + step) % n step by step, including how Python wraps negative numbers.