MicroSims
MicroSims are small, interactive educational simulations — each one focused on
a single concept. They live under docs/sims/<sim-name>/ and are embedded
into chapters via iframes.
New MicroSims can be created with the microsim-generator skill, which routes
to the appropriate library (p5.js, Chart.js, vis-network, Mermaid, Leaflet,
Plotly, Venn.js).
Catalog
-
Data Model Comparison Explorer
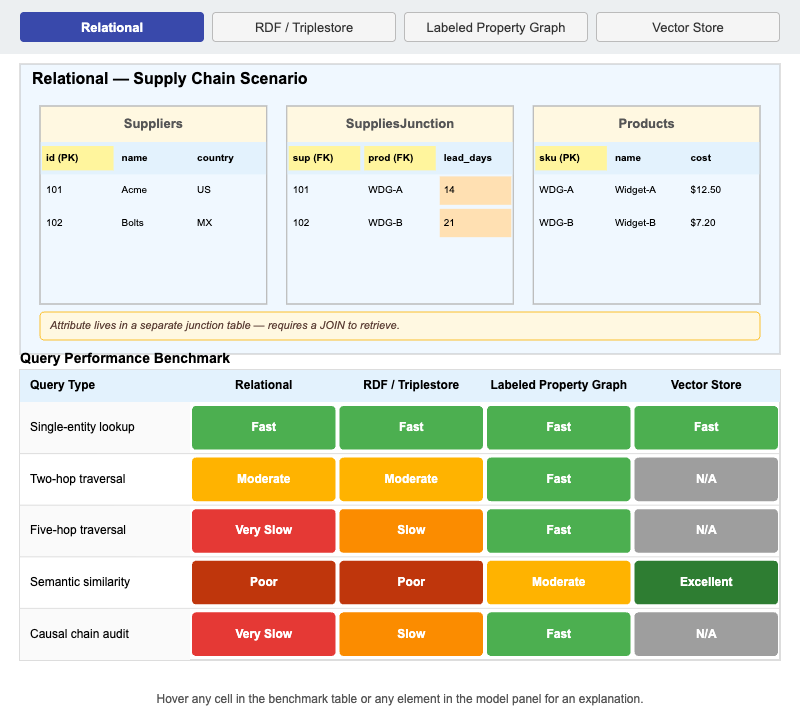
Compare Relational, RDF, LPG, and Vector Store data models side-by-side with a 5×4 query performance benchmark. Chapter 1 · p5.js
-
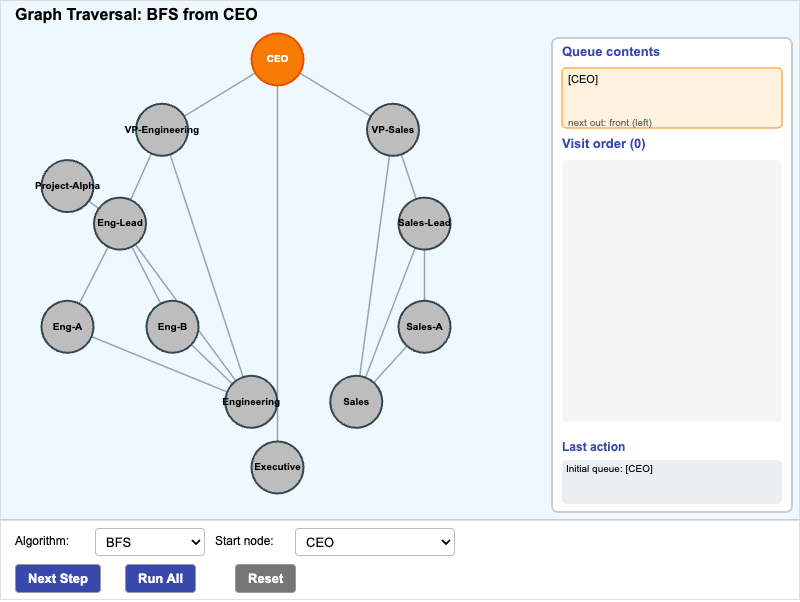
Step through BFS and DFS on a 12-node enterprise org graph; watch the queue/stack and visit order build up. Chapter 1 · p5.js
-
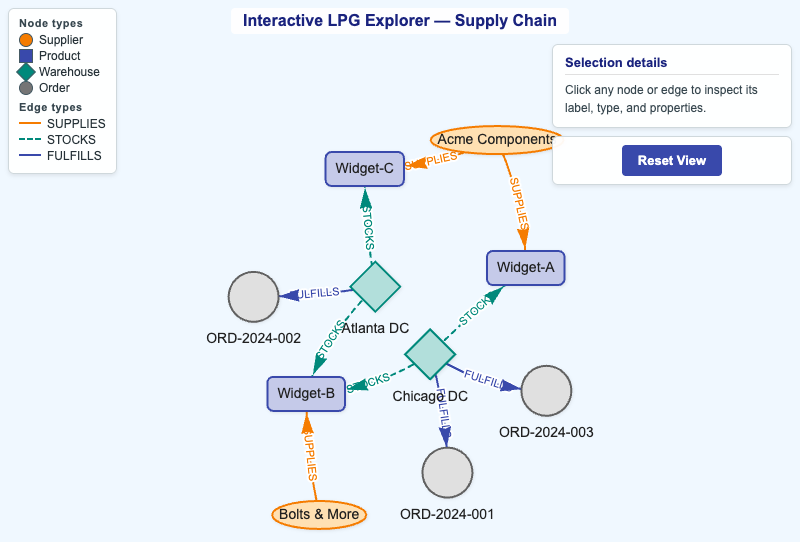
Click nodes and edges in a supply-chain Labeled Property Graph to inspect labels, types, and properties. Chapter 1 · vis-network
-
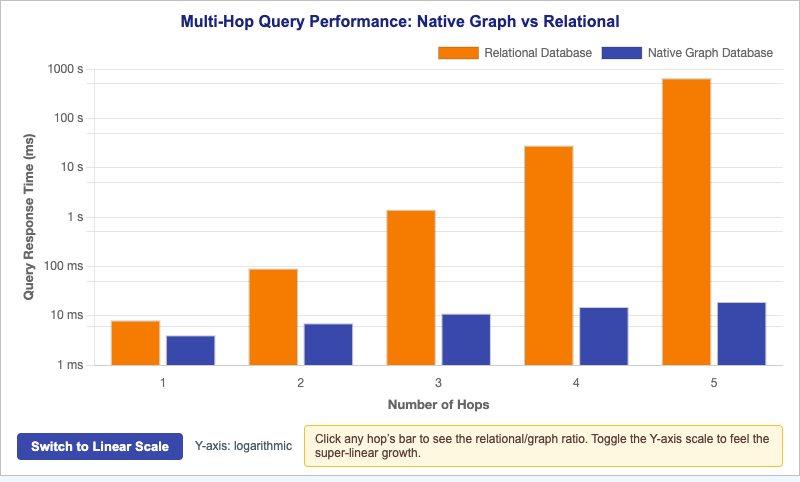
Compare native graph (linear) vs relational (super-linear) query latency across 1–5 hops; toggle log/linear scale. Chapter 1 · Chart.js
-
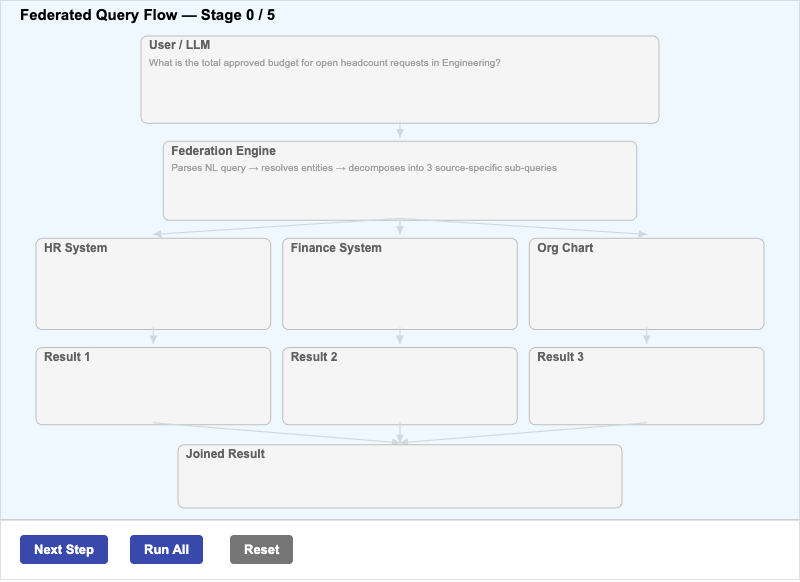
Step through a federated business query as it's decomposed into SQL, REST, and graph sub-queries, then re-joined. Chapter 2 · p5.js
-
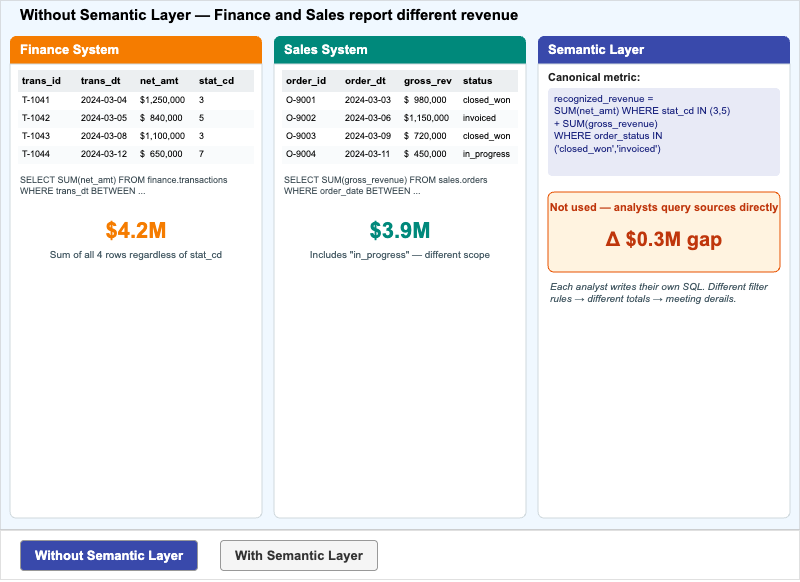
Compare Finance and Sales revenue numbers and see how a semantic layer reconciles them into one canonical metric. Chapter 2 · p5.js
-
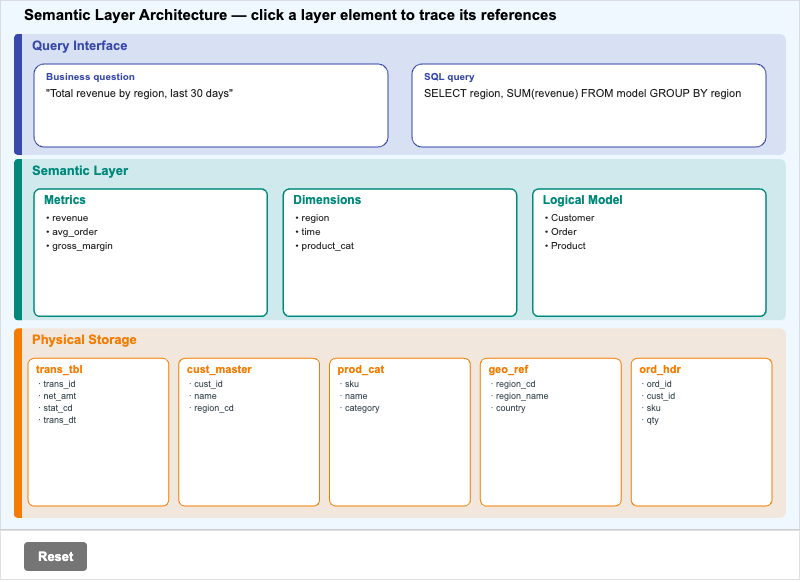
Click any element across the Query Interface, Semantic Layer, and Physical Storage bands to trace its references. Chapter 2 · p5.js
-
Metadata Catalog to Context Graph Flow
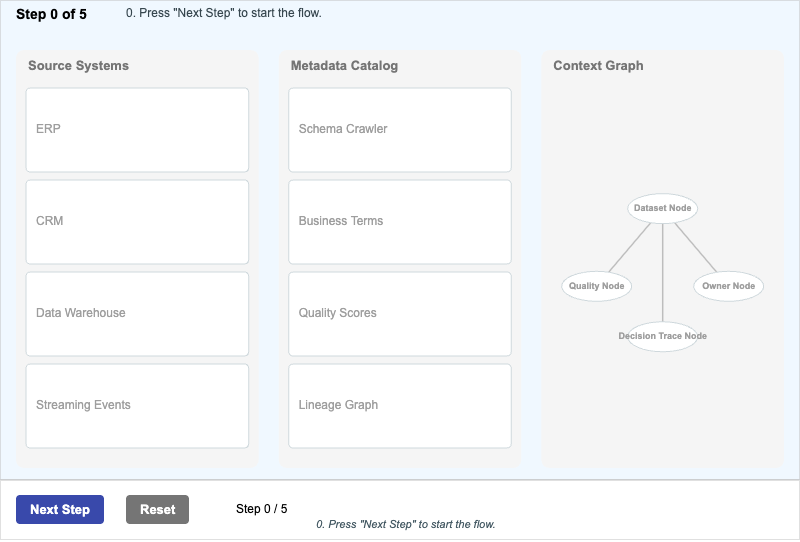
Step through how metadata moves from source systems through a catalog platform and into a context graph. Chapter 3 · p5.js
-
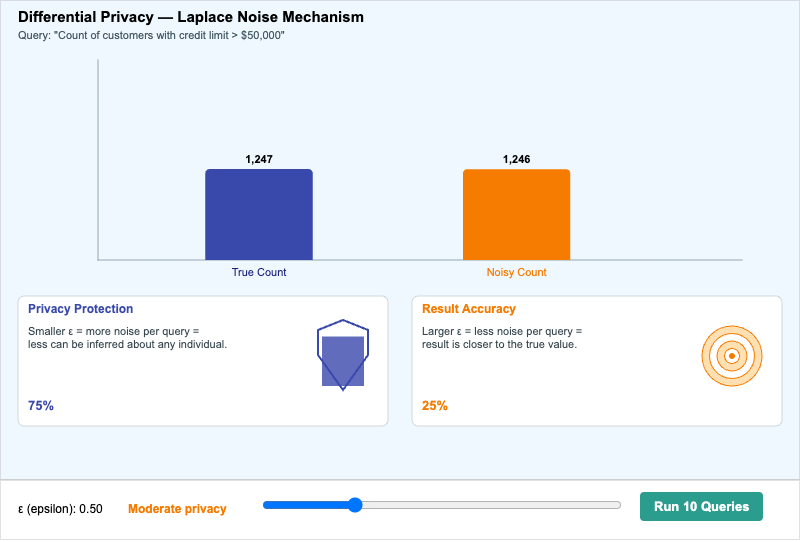
Drag the epsilon slider and feel the trade-off between privacy and result accuracy via Laplace-noise simulation. Chapter 3 · p5.js
-
Governance Framework Concept Map
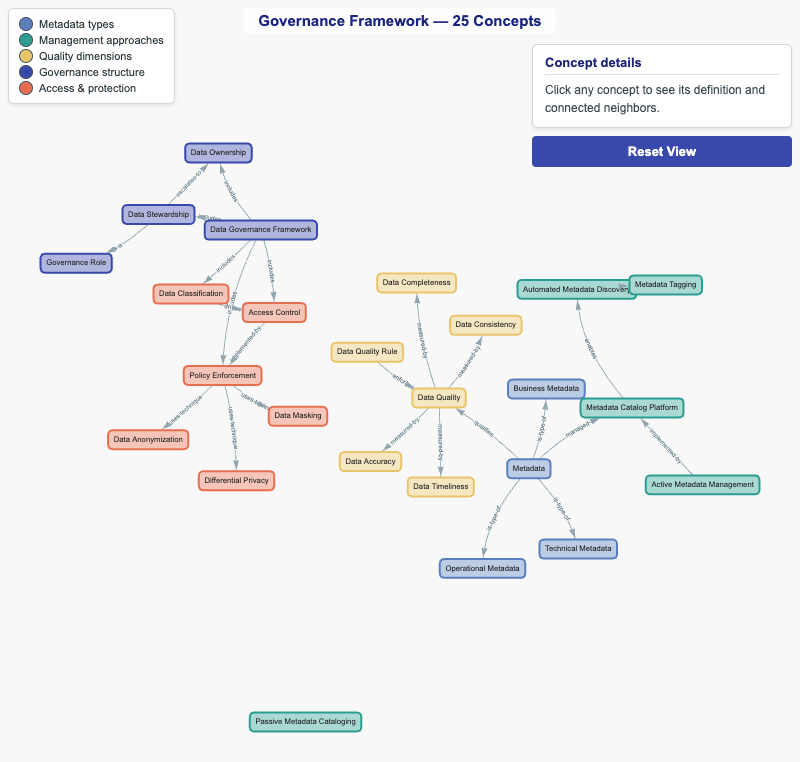
Explore 25 governance concepts in five color-coded clusters; click any concept to see its definition and connections. Chapter 3 · vis-network
-
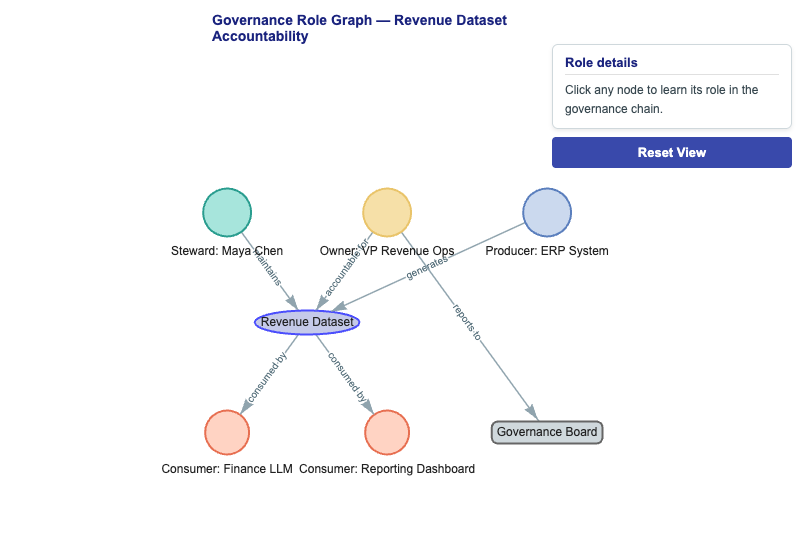
Trace the accountability chain from a dataset to steward, owner, producer, consumers, and the governance board. Chapter 3 · vis-network
-
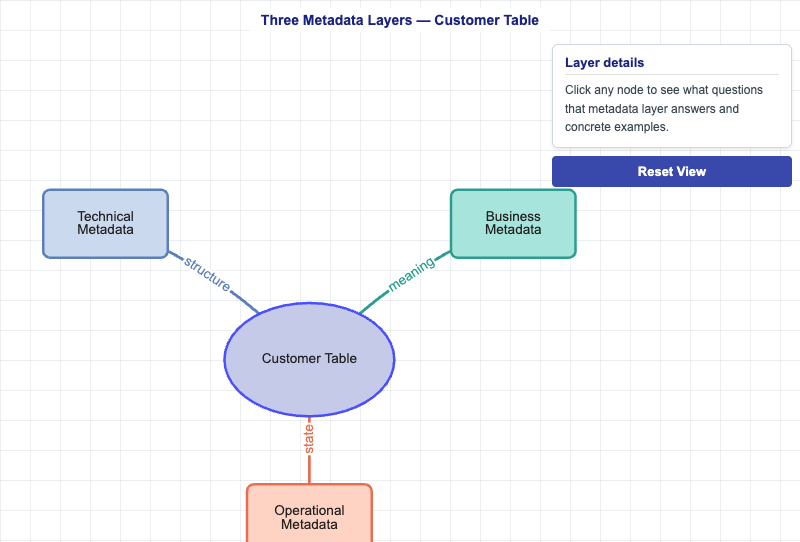
Radial diagram showing technical, business, and operational metadata attached to a single Customer Table. Chapter 3 · vis-network
-
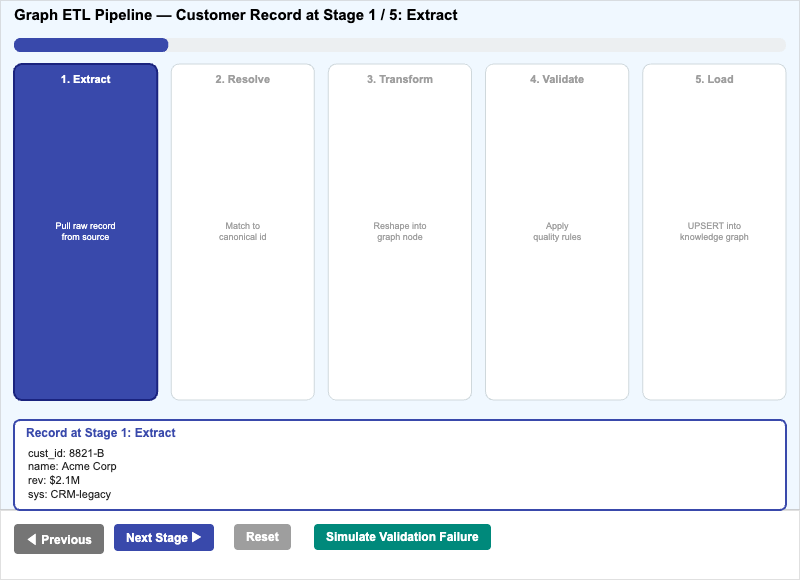
Step a Customer record through Extract → Resolve → Transform → Validate → Load with a failure-mode toggle. Chapter 4 · p5.js
-
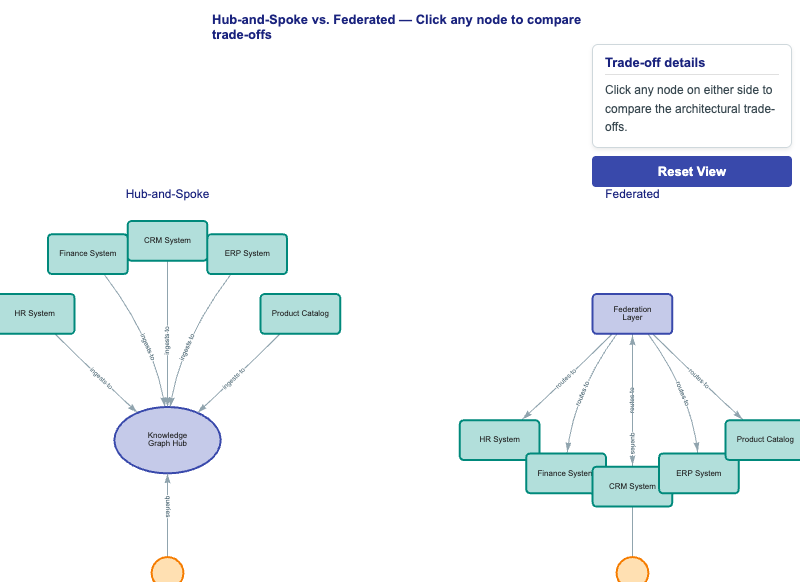
Side-by-side knowledge-graph architectures; click any node to surface the trade-offs each side encodes. Chapter 4 · vis-network
-
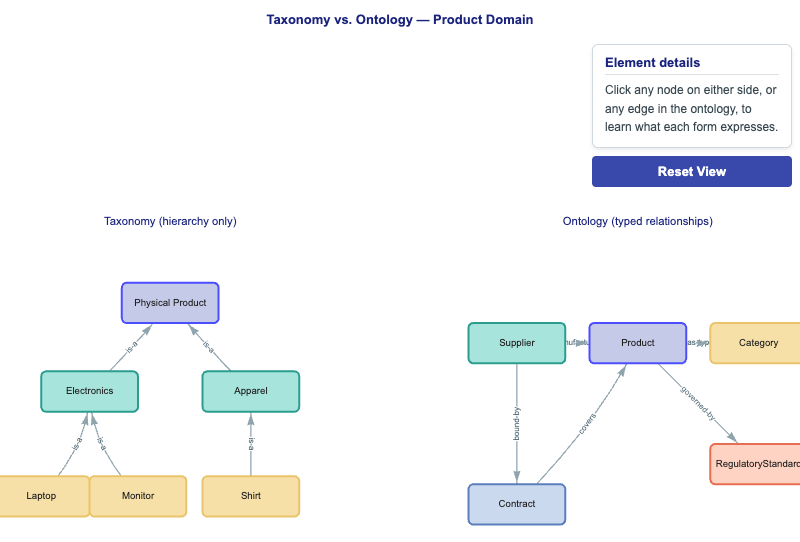
Contrast a hierarchy-only taxonomy with a richly-typed ontology for the same product domain. Chapter 4 · vis-network
-
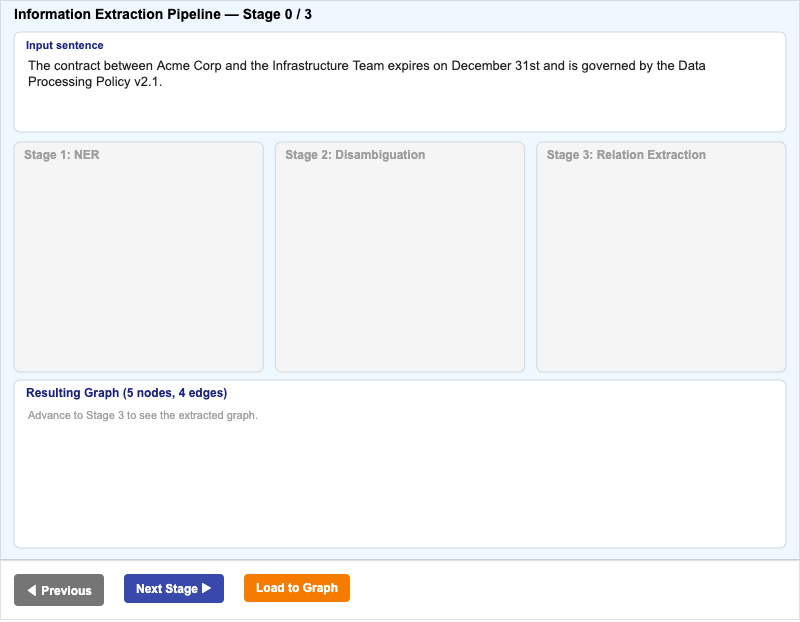
Walk an unstructured sentence through NER → disambiguation → relation extraction into a small RDF-style graph. Chapter 5 · p5.js
-
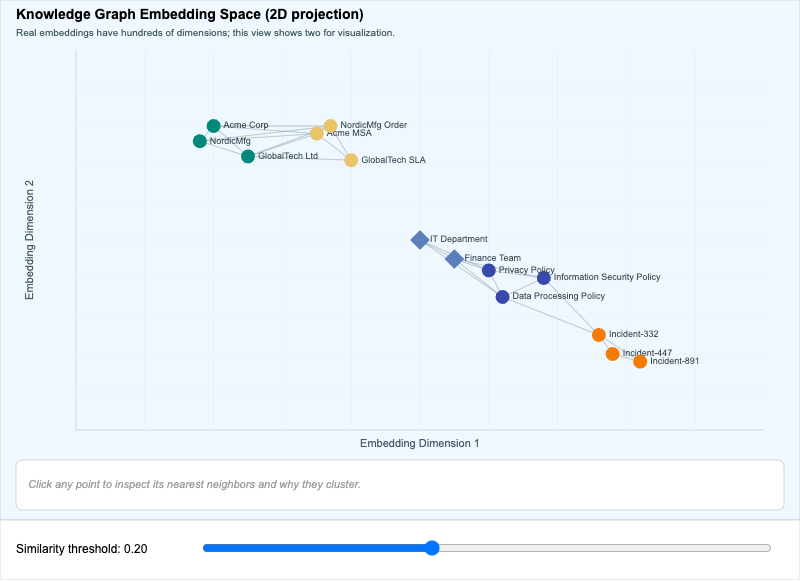
Click points in a 2D embedding scatter to see nearest neighbors and cluster meaning; slide the similarity threshold. Chapter 5 · p5.js
-
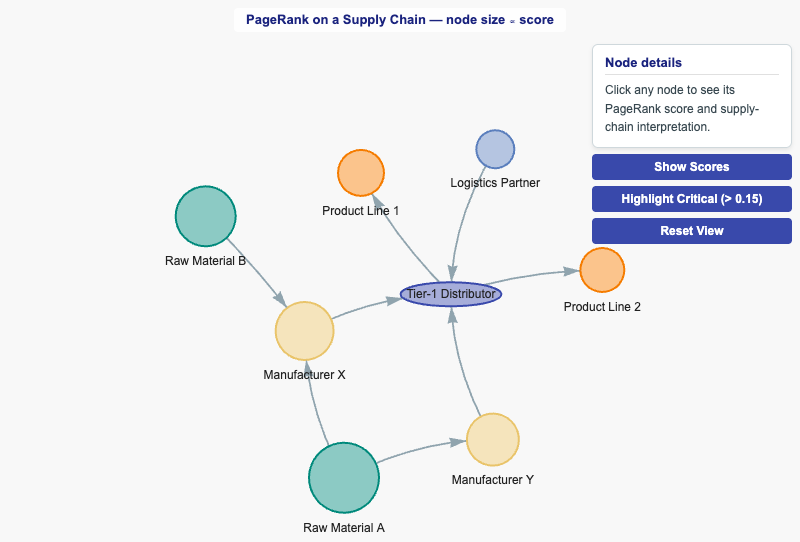
Eight-node supply chain with node size proportional to PageRank score; click any node for its risk interpretation. Chapter 5 · vis-network
-
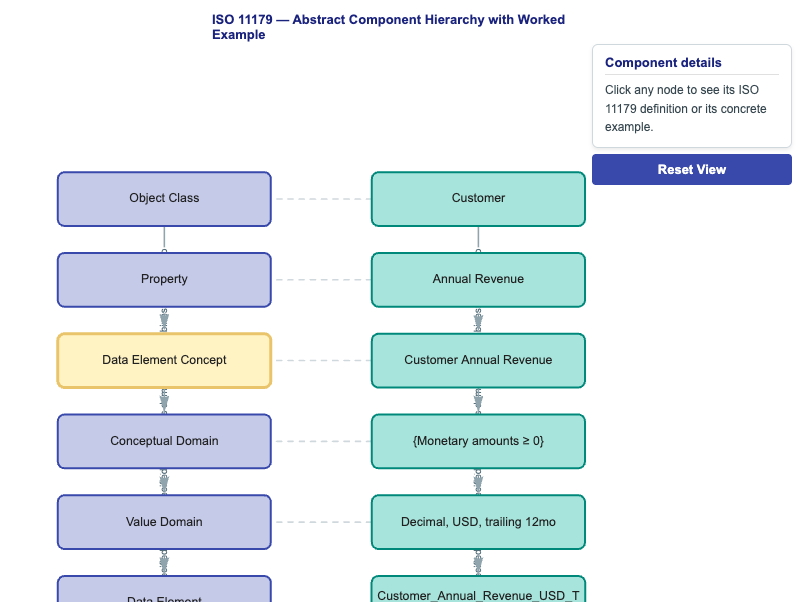
Six-level ISO 11179 component hierarchy alongside a worked Customer Annual Revenue example. Chapter 6 · vis-network
-
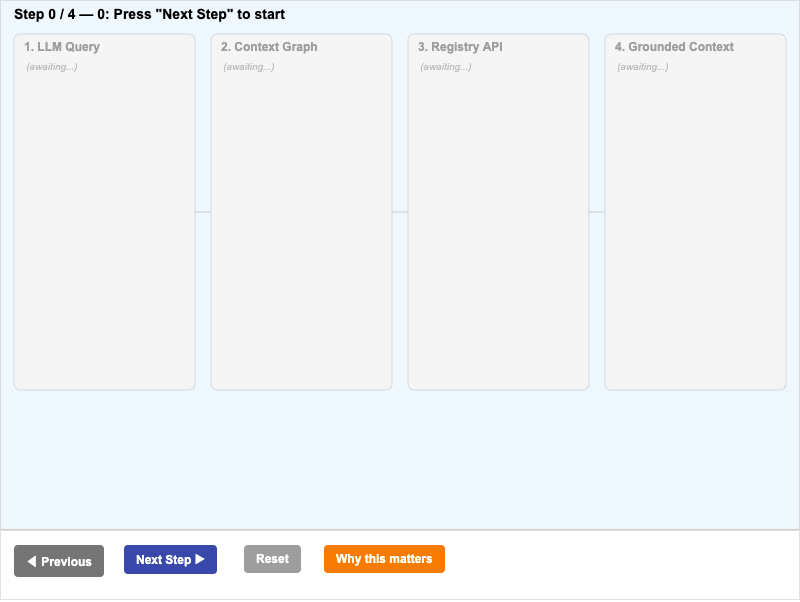
Trace a query through context graph + registry API to produce a grounded LLM payload with units and version. Chapter 6 · p5.js
-
Registry vs Catalog Architecture
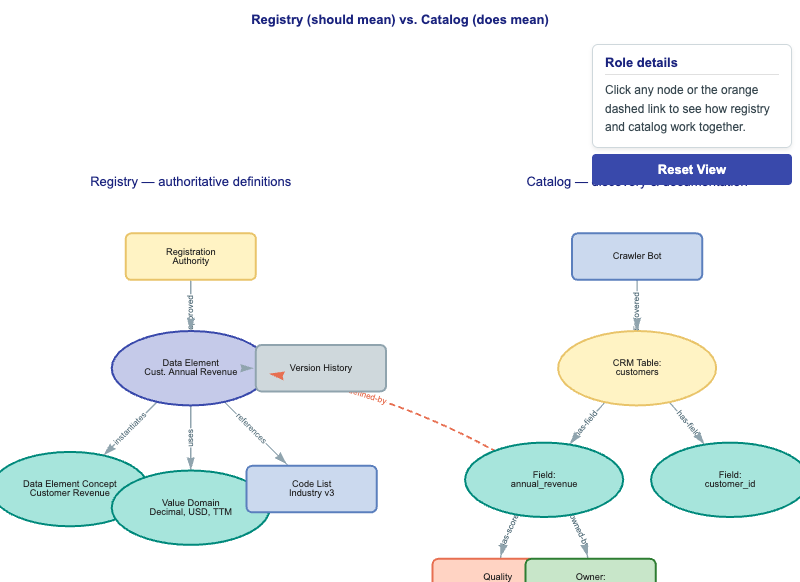
Contrast an authoritative registry with a discovery-oriented catalog; follow the dashed integration link between them. Chapter 6 · vis-network
-
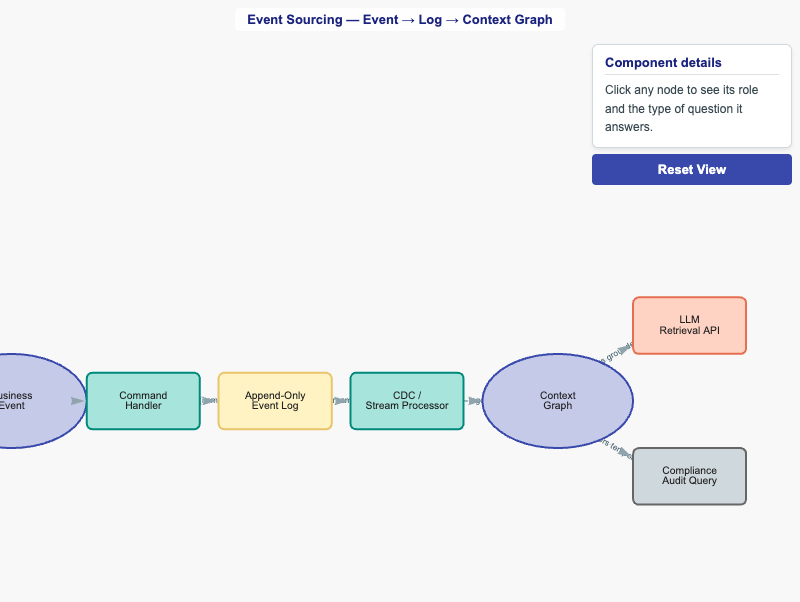
Trace a business event through command handler, append-only log, stream processor, and into the context graph. Chapter 7 · vis-network
-
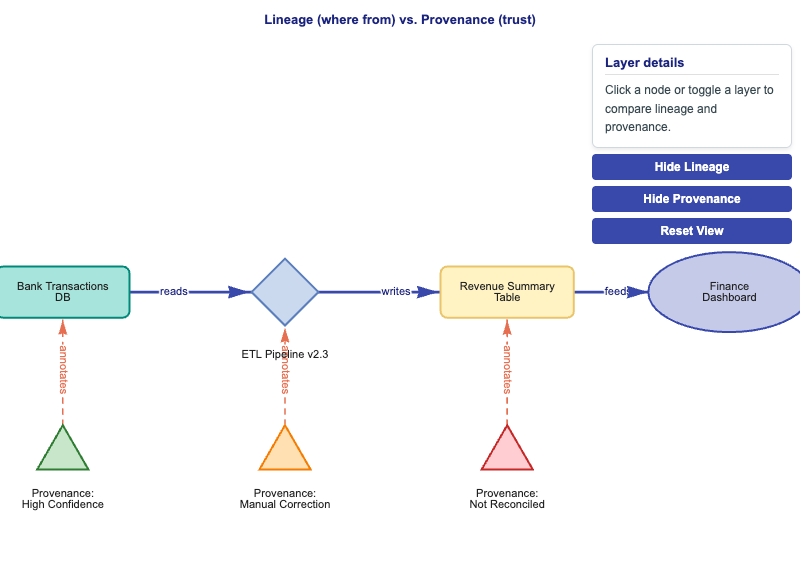
Toggle lineage (where data came from) and provenance (whether to trust it) layers in the same pipeline graph. Chapter 7 · vis-network
-
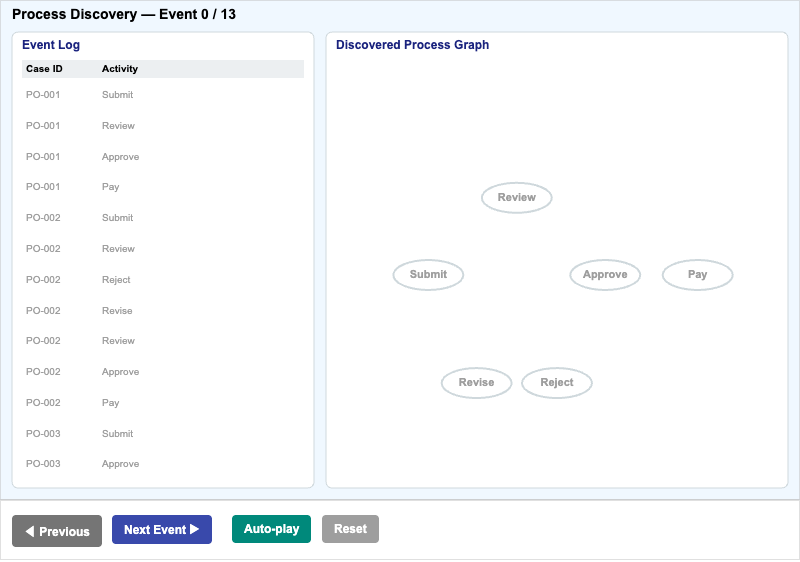
Watch a directly-follows graph build itself from an event log of three purchase-order cases, flagging deviations in orange. Chapter 7 · p5.js
-
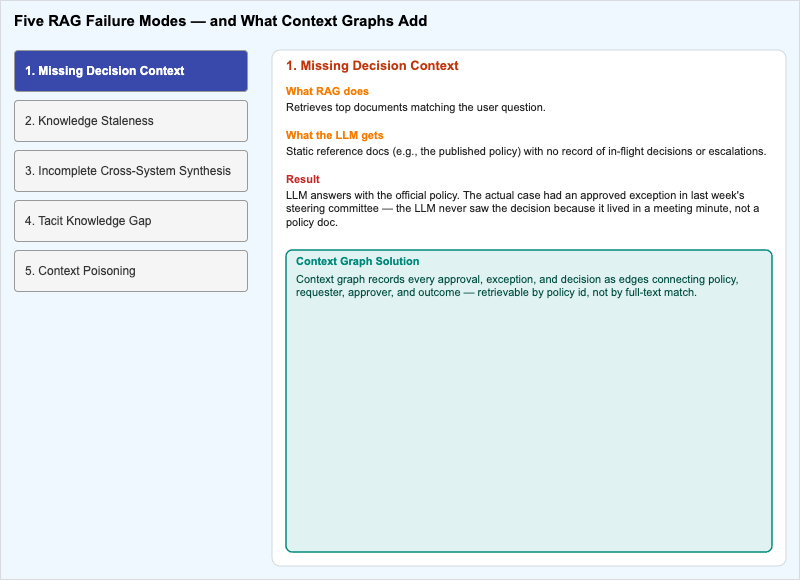
Click through five RAG failure modes and the context-graph fix for each: decision context, staleness, synthesis, tacit knowledge, poisoning. Chapter 8 · p5.js
-
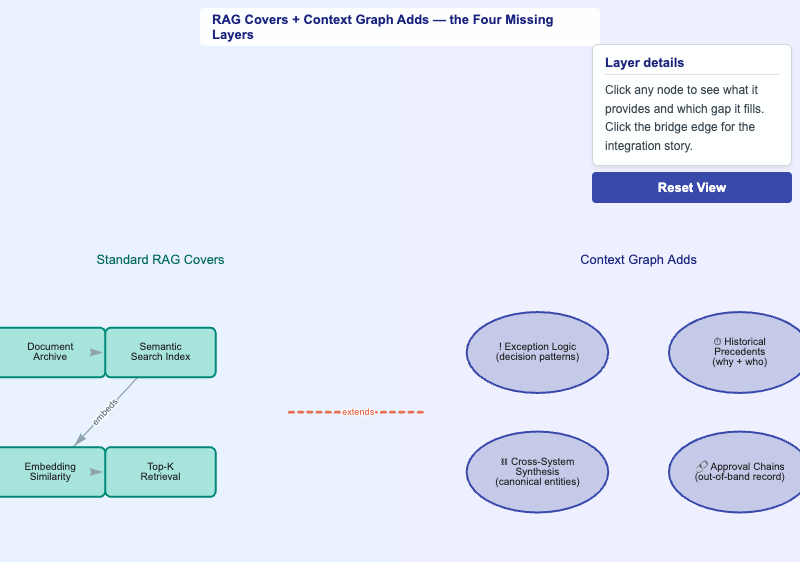
Two-panel diagram contrasting what RAG covers with the four organizational layers context graphs add. Chapter 8 · vis-network
-
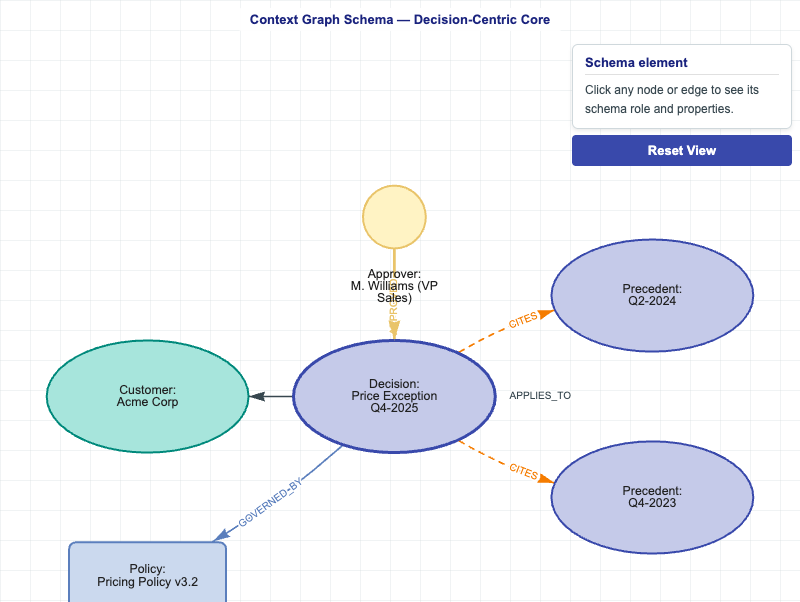
Inspect the four core schema elements of a context graph — Decision Node, Entity Link, Approval Edge, Precedent Link. Chapter 9 · vis-network
-
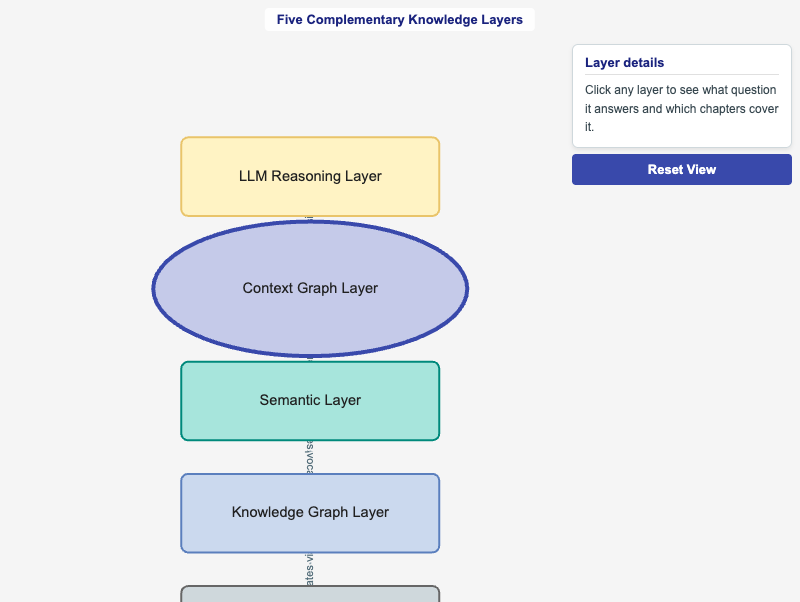
Five-layer enterprise AI stack: LLM Reasoning → Context Graph → Semantic → Knowledge Graph → Raw Data. Chapter 9 · vis-network
-
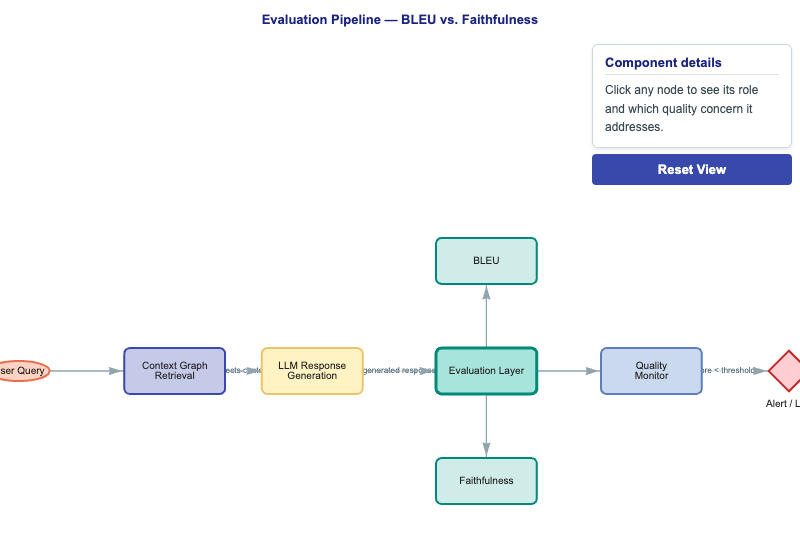
Compare BLEU and Faithfulness evaluators; both feed a quality monitor that fires alerts when scores drop. Chapter 10 · vis-network
-
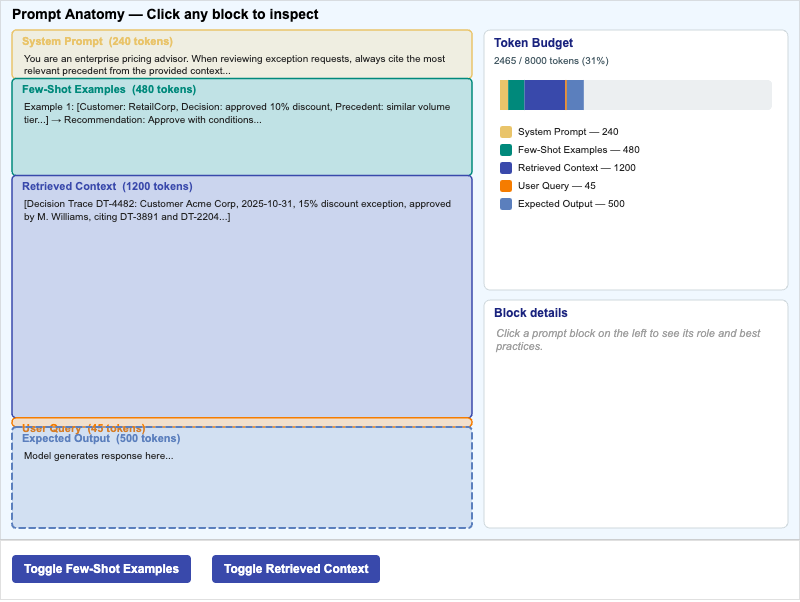
Stack of system prompt + few-shot + context + query blocks with a live token-budget chart and toggle buttons. Chapter 10 · p5.js
-
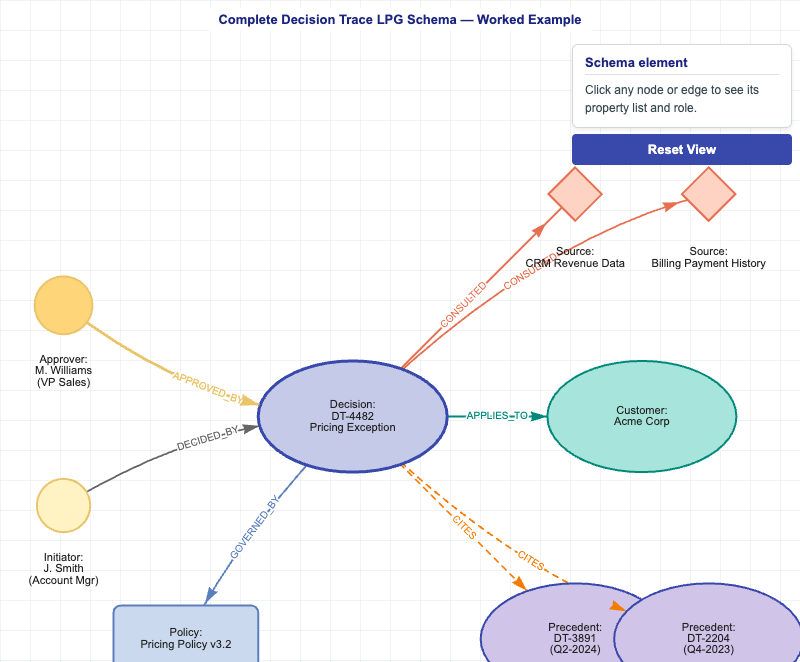
Fully-populated decision trace showing initiator, approver, customer, policy, precedents, and source data nodes with all edge types. Chapter 11 · vis-network
-
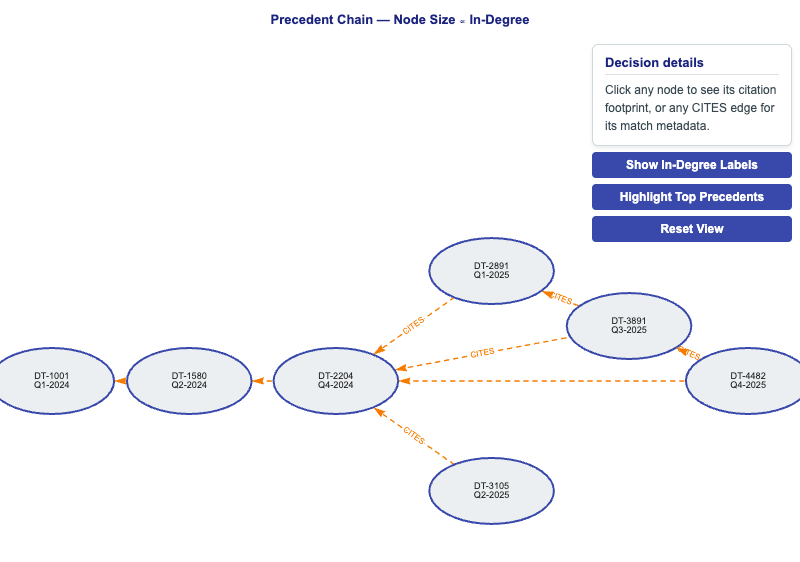
Seven-decision citation chain with node size proportional to in-degree; toggle degree labels and top-precedent highlighting. Chapter 11 · vis-network
-
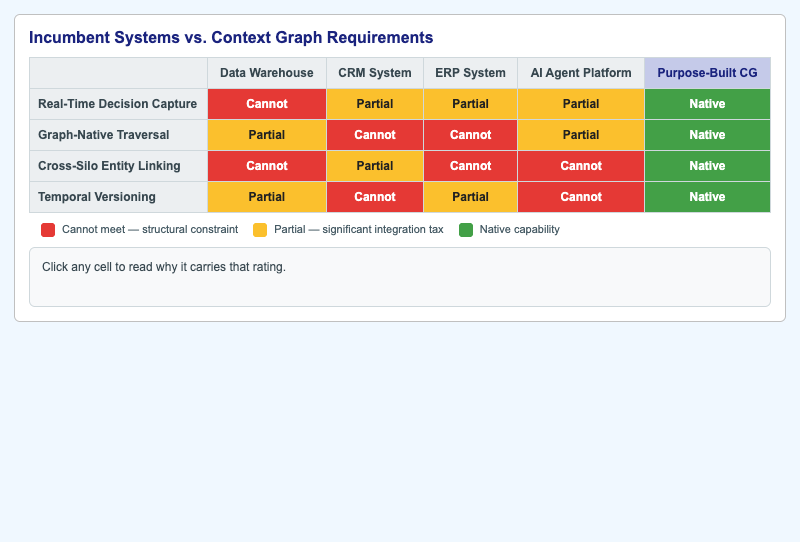
4×5 ratings grid scoring incumbent systems (Data Warehouse, CRM, ERP, AI Agent, Purpose-Built CG) against the four context-graph requirements. Chapter 12 · HTML
-
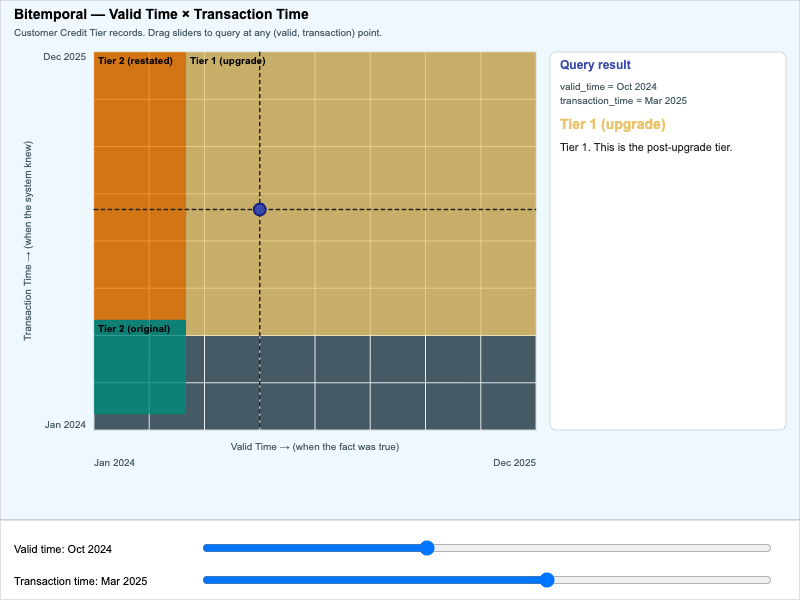
2D time grid with crosshair sliders showing valid-time × transaction-time queries against three credit-tier records. Chapter 13 · p5.js
-
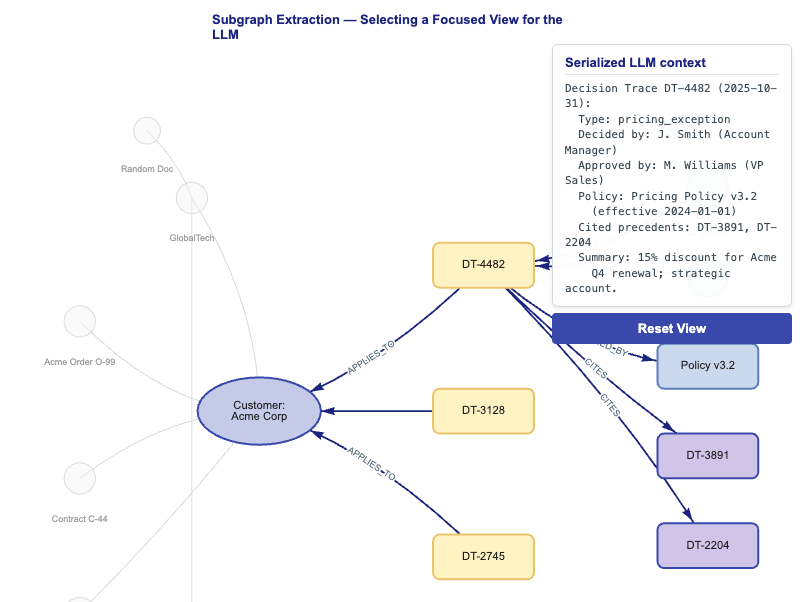
Highlighted subgraph plus prose serialization showing how a focused context is assembled for the LLM from a full graph. Chapter 13 · vis-network
-
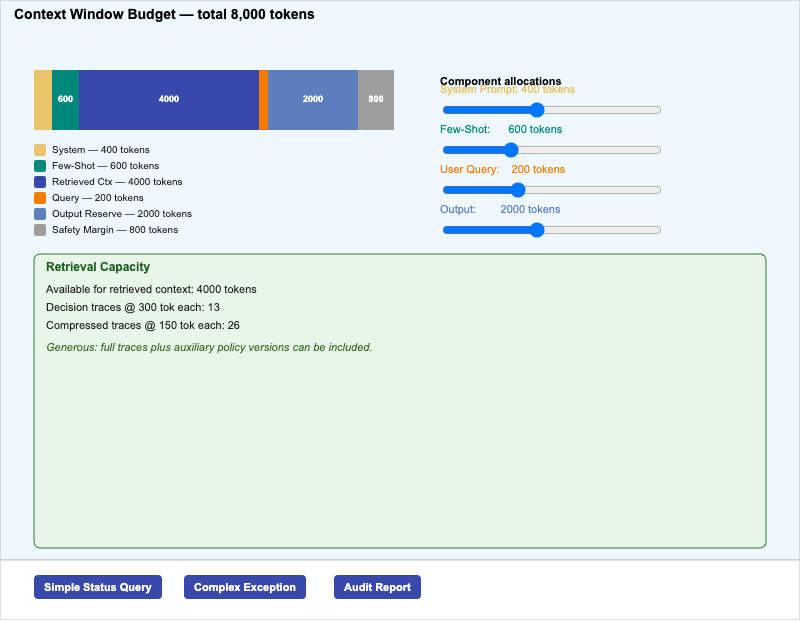
Allocate 8K tokens across prompt, few-shot, retrieved context, query, and output reservation with three use-case presets. Chapter 14 · p5.js
-
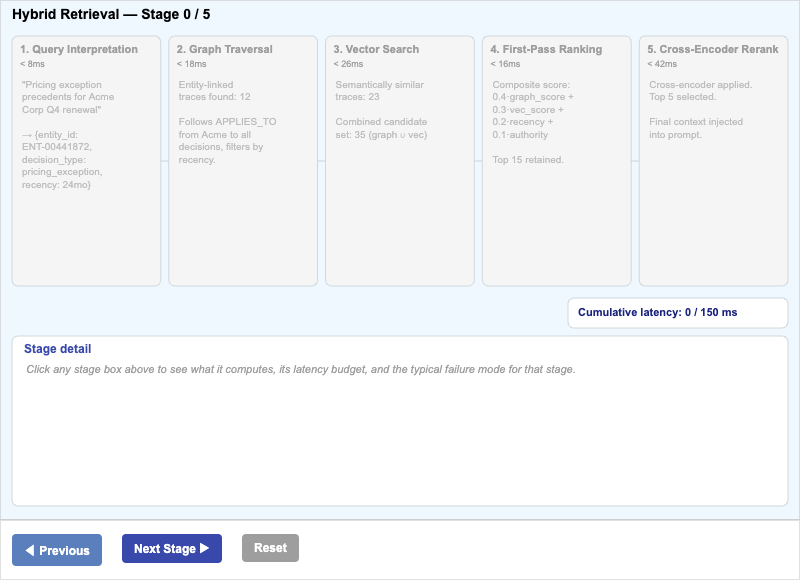
Step through Query Interp → Graph Traversal → Vector Search → Composite Rank → Cross-Encoder Rerank with per-stage latency budget. Chapter 14 · p5.js
-
Ingestion Pipeline Architecture
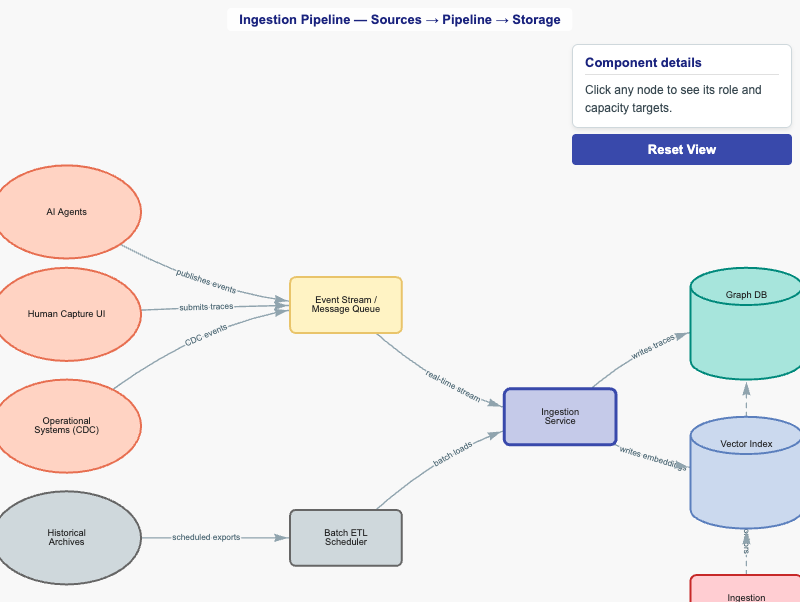
Sources (agents, humans, CDC, batch) → event stream + batch ETL → ingestion service → graph DB + vector index, with monitoring. Chapter 15 · vis-network
-
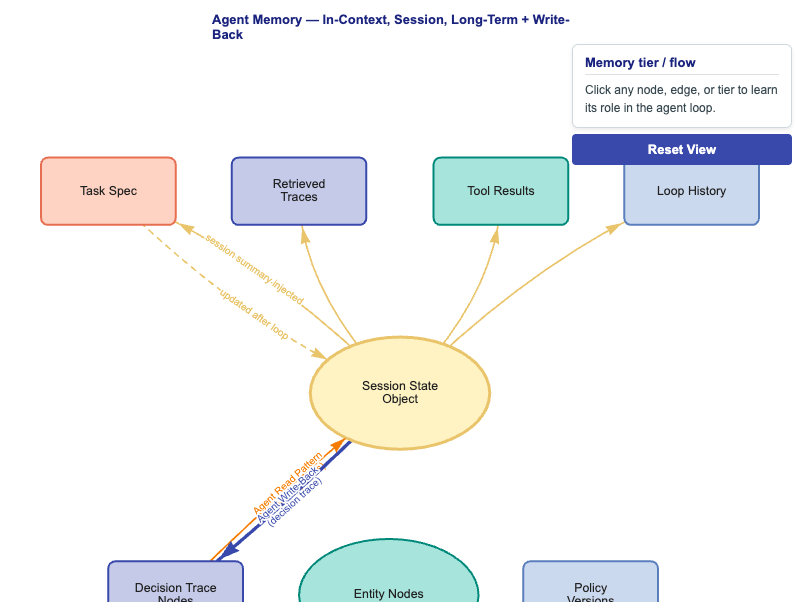
Three-tier memory: in-context (ephemeral), session (per-loop), long-term (context graph) with the agent write-back loop. Chapter 16 · vis-network
-
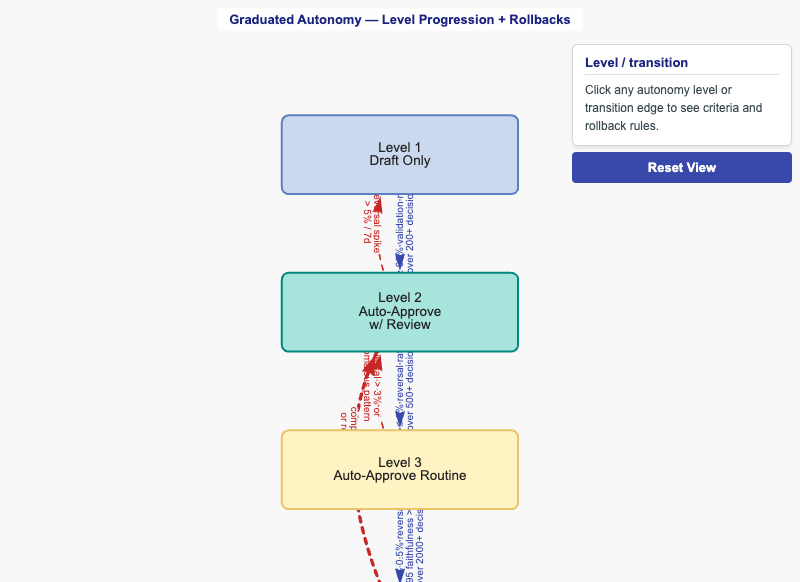
Four-level autonomy ladder (Draft → Full Autonomy) with promotion criteria and rollback rules; click any transition to see the rationale. Chapter 16 · vis-network
-
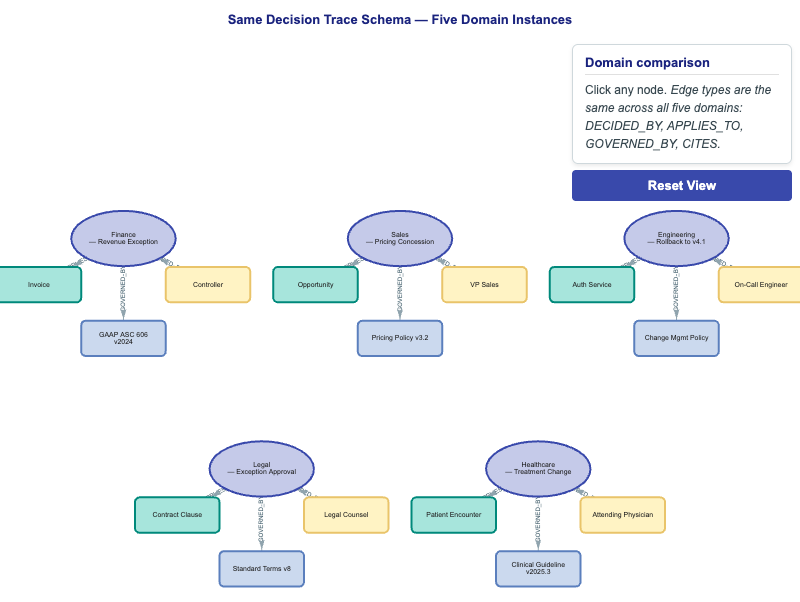
Same decision trace schema instantiated across Finance, Sales, Engineering, Legal, and Healthcare. Chapter 17 · vis-network
-
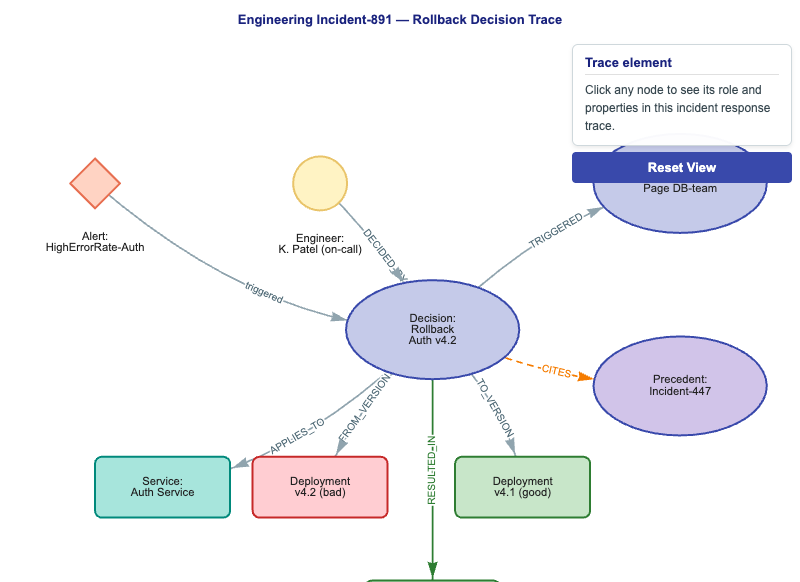
Fully-instantiated engineering incident trace: alert → rollback decision → service/deployment entities → resolution. Chapter 17 · vis-network
-
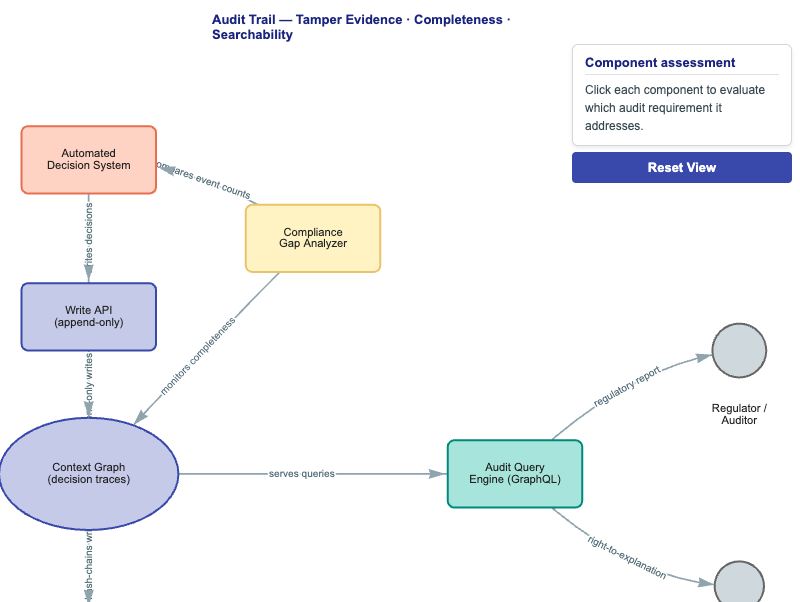
Components meeting three audit requirements (tamper evidence, temporal completeness, searchability) for regulated context graph systems. Chapter 18 · vis-network
-
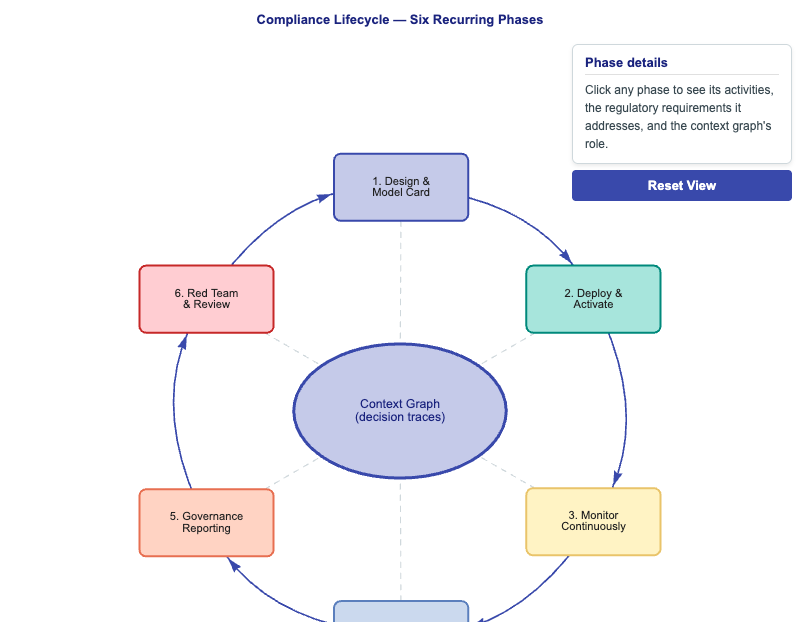
Six-phase circular lifecycle (Design → Deploy → Monitor → Audit → Govern → Red Team) around the context graph. Chapter 18 · vis-network