List of MicroSims for Food Science
Interactive Micro Simulations to help 9th-grade students learn food science fundamentals — from molecules and microbes to baking, nutrition, and sustainable food systems. Each MicroSim focuses on a single concept and is embedded into chapters via iframes.
-
Bacteria Cell Structure Explorer
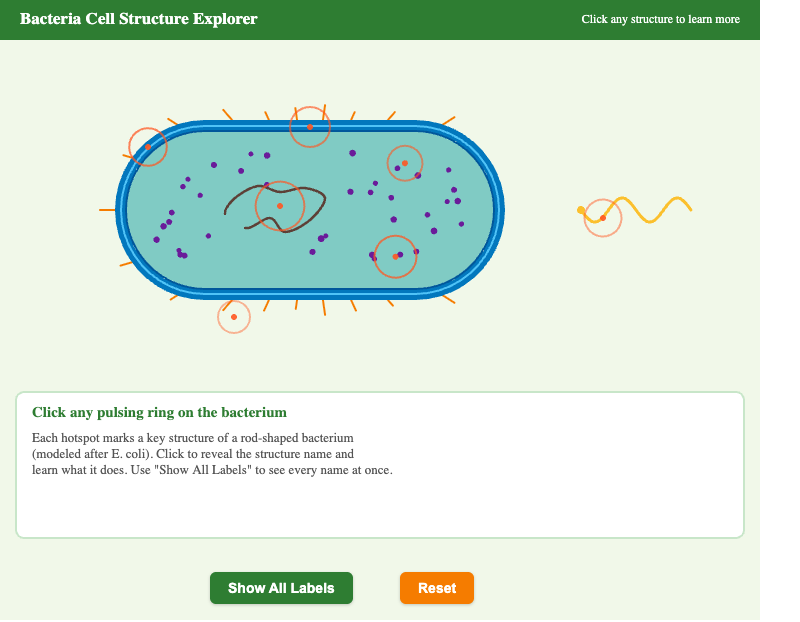
Click on each labeled part of a bacterial cell to learn its name and function. Identifies the key structures that make microbes unique.
-
Bacterial Growth Curve Simulation
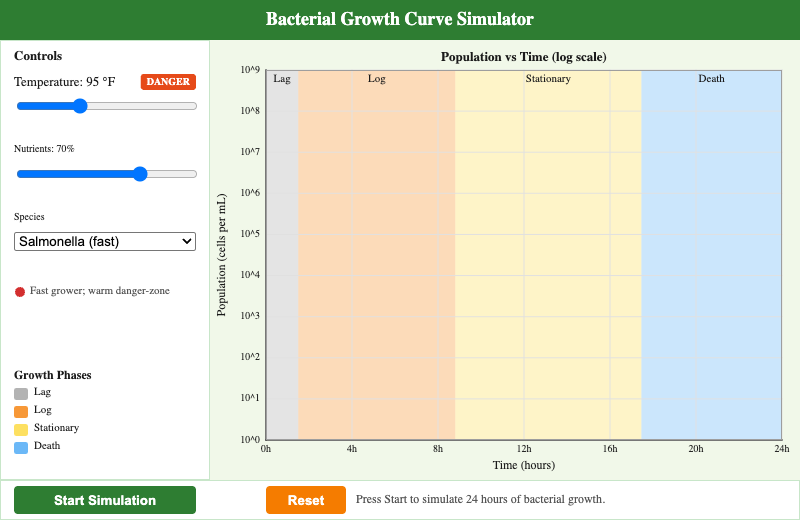
Adjust temperature and nutrients to see how bacterial populations move through the lag, log, stationary, and death phases of growth.
-
Carbohydrate Size Ladder — From Sugar to Starch
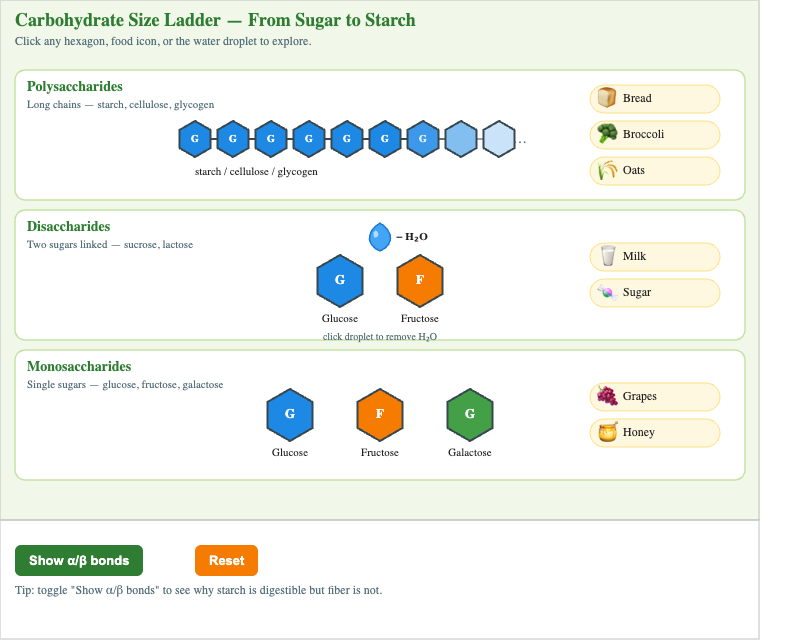
Climb the ladder from single sugars (monosaccharides) up to disaccharides and starches, showing how small units link into larger carbohydrates.
-
Carbon Footprint of Common Foods
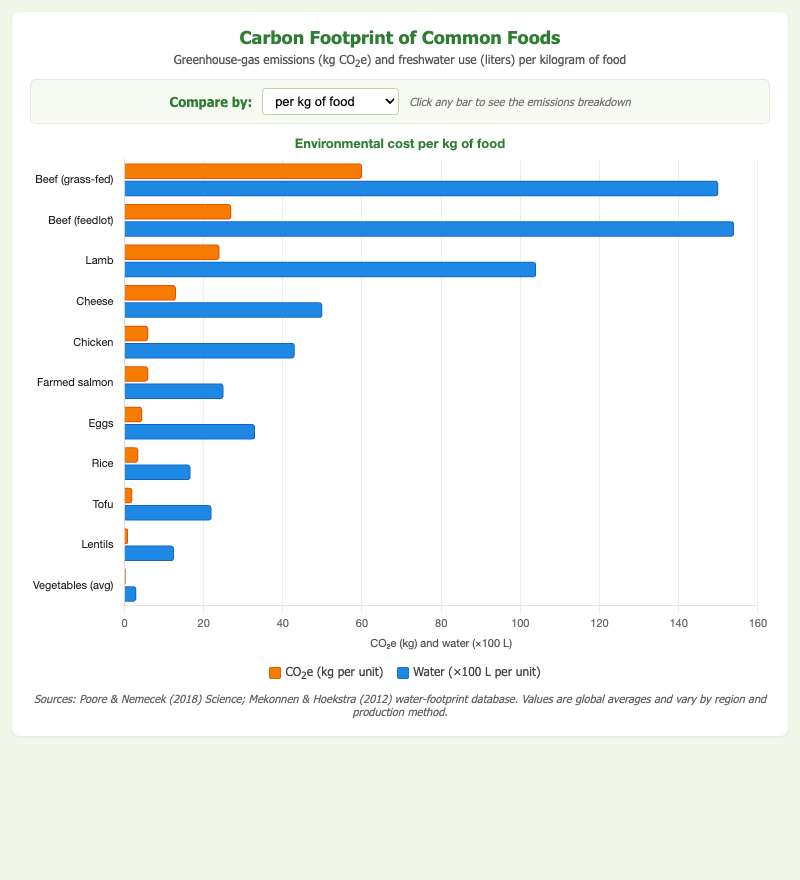
Interactive Chart.js bar chart comparing the greenhouse-gas emissions of common foods, revealing which choices have the largest environmental impact.
-
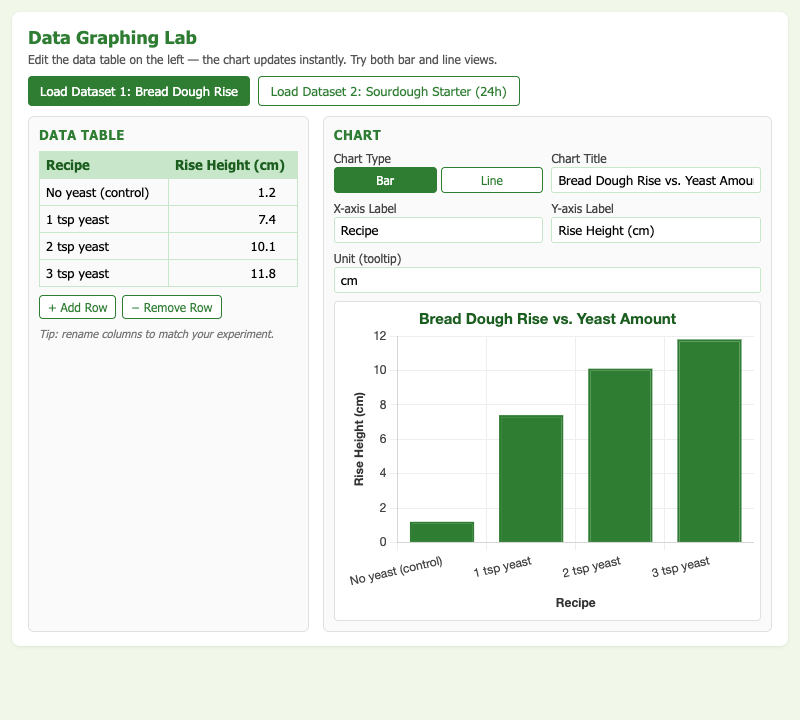
Build and interpret bar graphs and line graphs from real food science data sets. Practice the core scientific skill of turning numbers into insight.
-
Digestive System Nutrient Journey
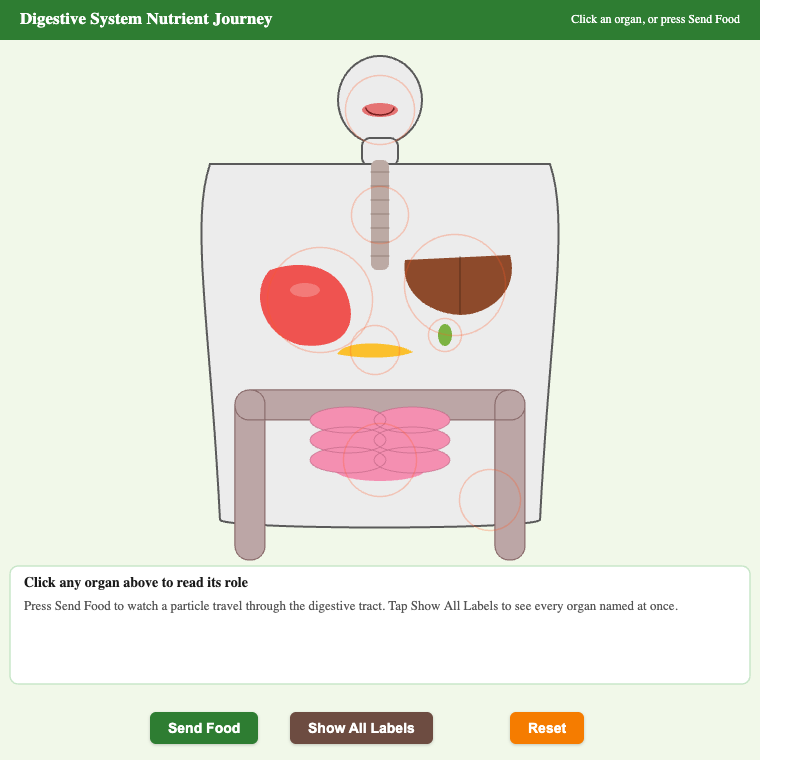
Follow a bite of food through each organ of the digestive system and watch how carbohydrates, proteins, and fats are broken down and absorbed.
-
Experimental Variables Identifier
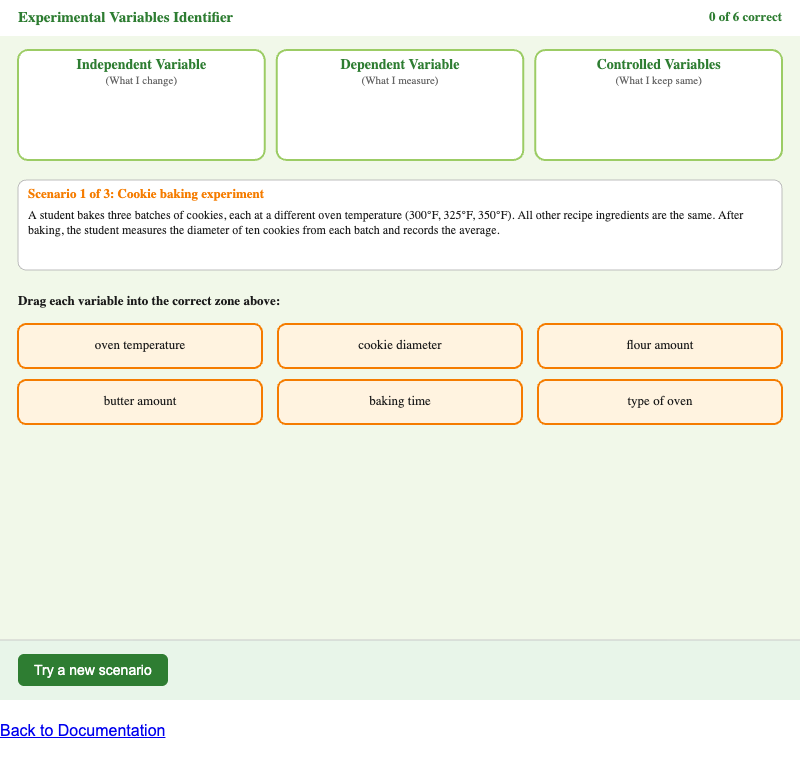
Read a food science experiment scenario and classify each factor as the independent, dependent, or controlled variable.
-
Freezing Rate and Ice Crystal Size
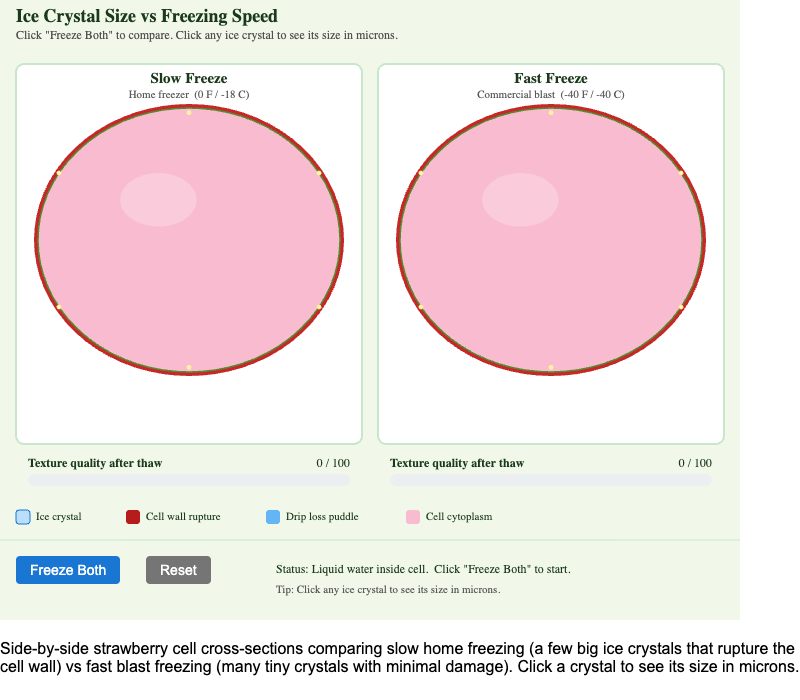
Compare slow home freezing to fast commercial freezing and see why crystal size determines whether your strawberry stays plump or turns to mush.
-
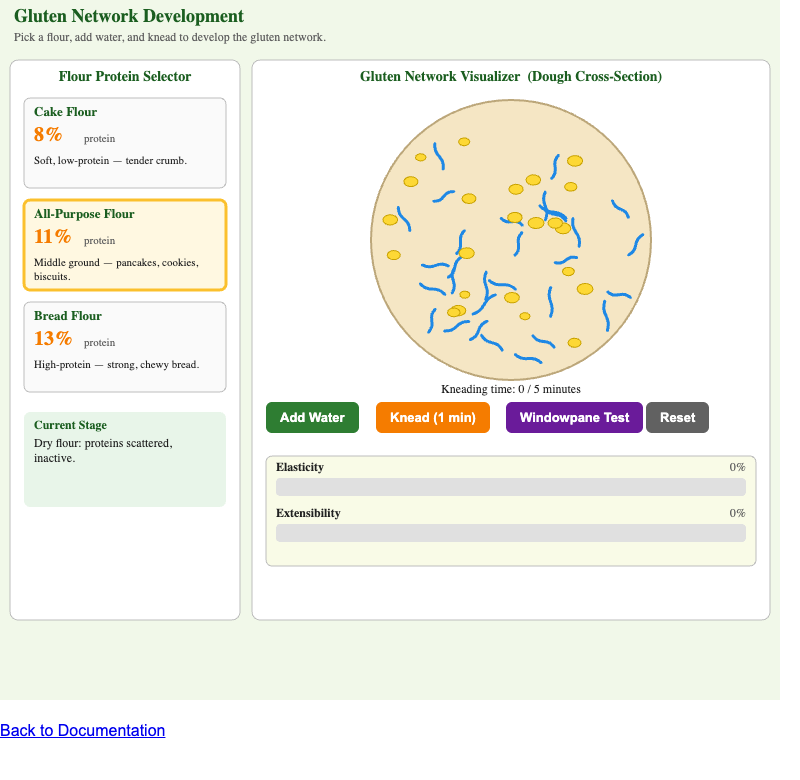
Watch glutenin and gliadin proteins link into the stretchy network that gives bread its structure. Adjust mixing time and protein content to see the effect.
-
Grilled Cheese Science Timeline
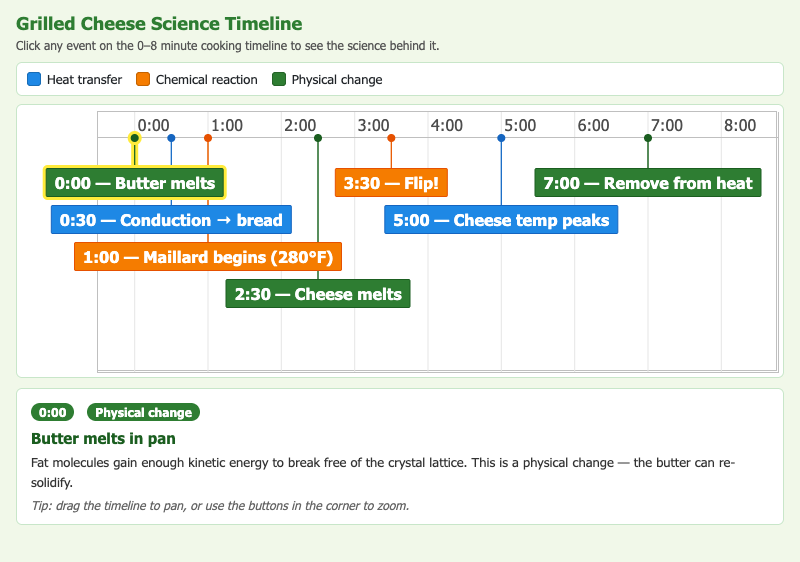
A vis-timeline walkthrough of every chemical and physical change that happens while a grilled cheese cooks — conduction, melting, Maillard browning, and more.
-
Hydroponic Project Data Dashboard
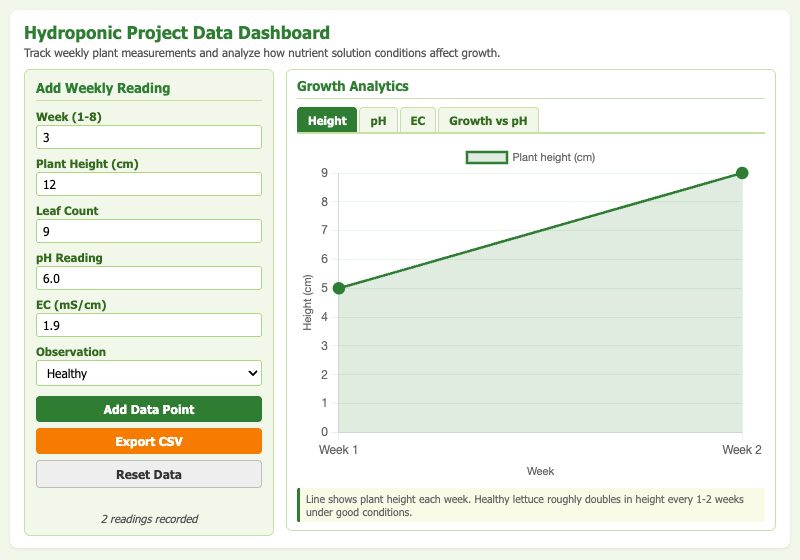
A Chart.js dashboard for tracking plant height, pH, and nutrient levels in a class hydroponic experiment over time.
-
Hydroponic System Types Comparison
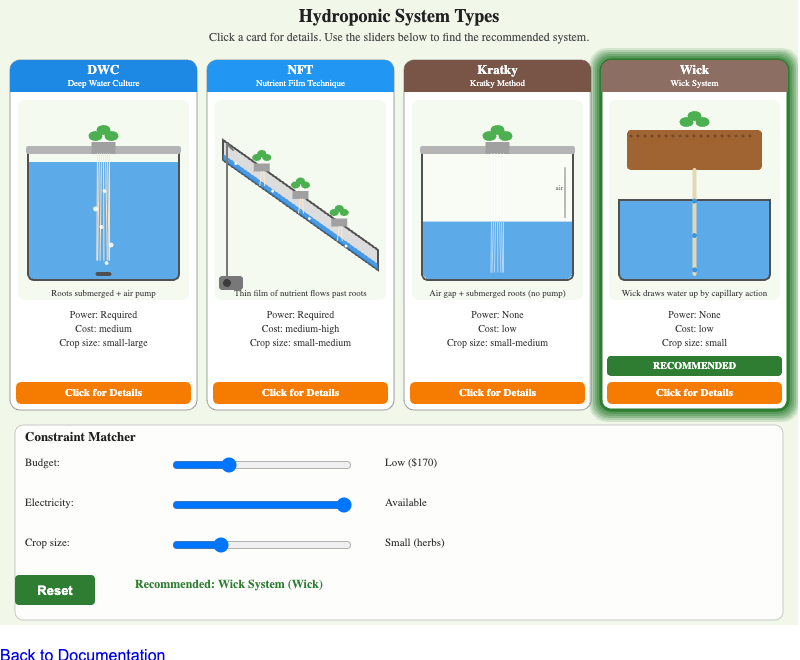
Compare the four main hydroponic system types (wick, deep water culture, NFT, ebb-and-flow) and choose the best fit for a given budget, space, and crop.
-
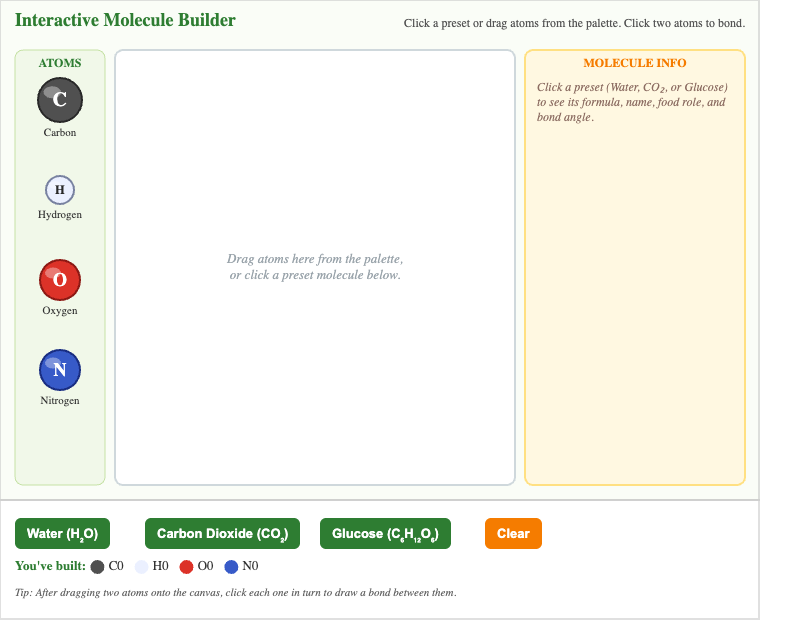
Snap together atoms to build water, sugar, and other key food molecules — and see how bonding creates compounds with properties unlike the elements that form them.
-
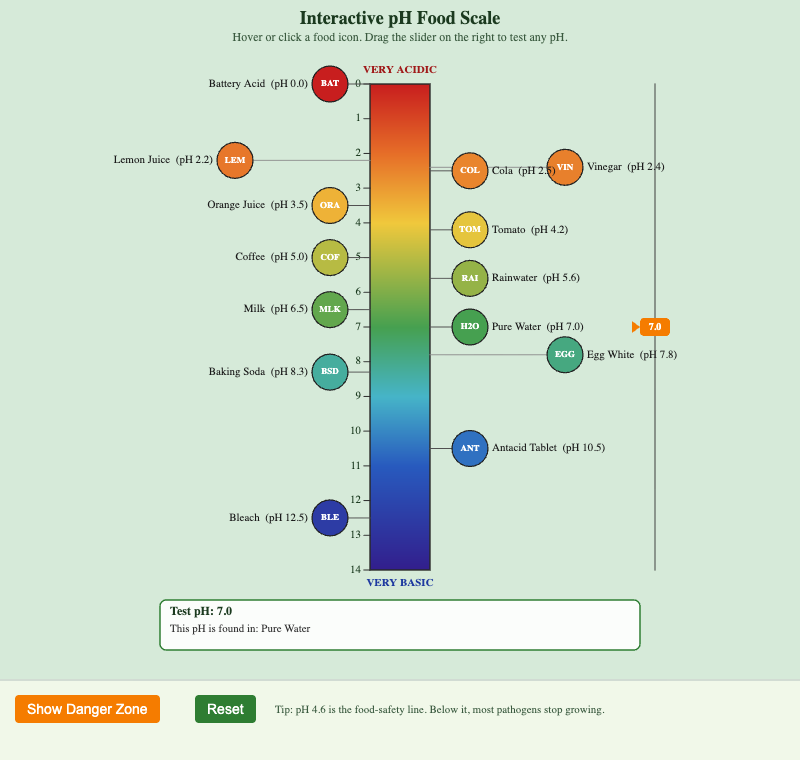
Place common foods on a pH scale from lemon juice to baking soda. Explore how pH connects to sour taste, safety, and food preservation.
-
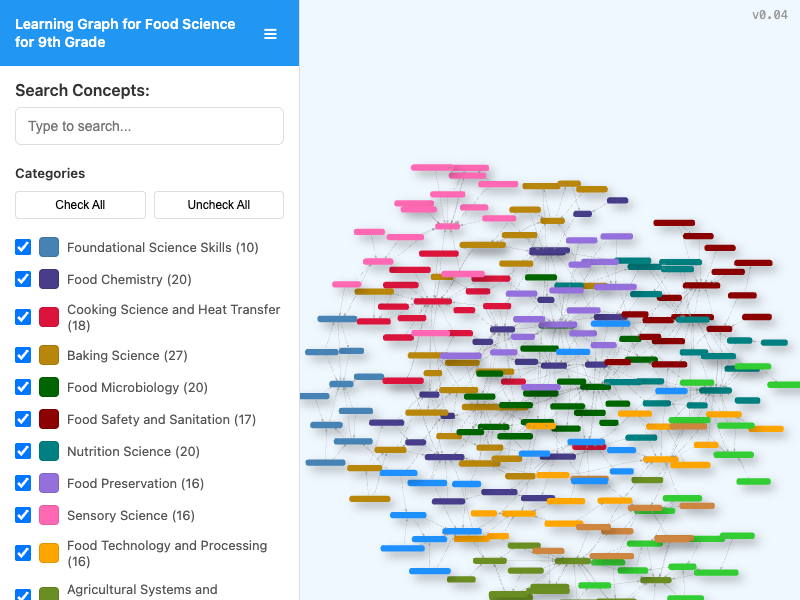
Browse the full concept dependency graph for the course. Search for any concept, filter by category, and trace prerequisite relationships interactively.
-
Maillard Reaction vs. Caramelization
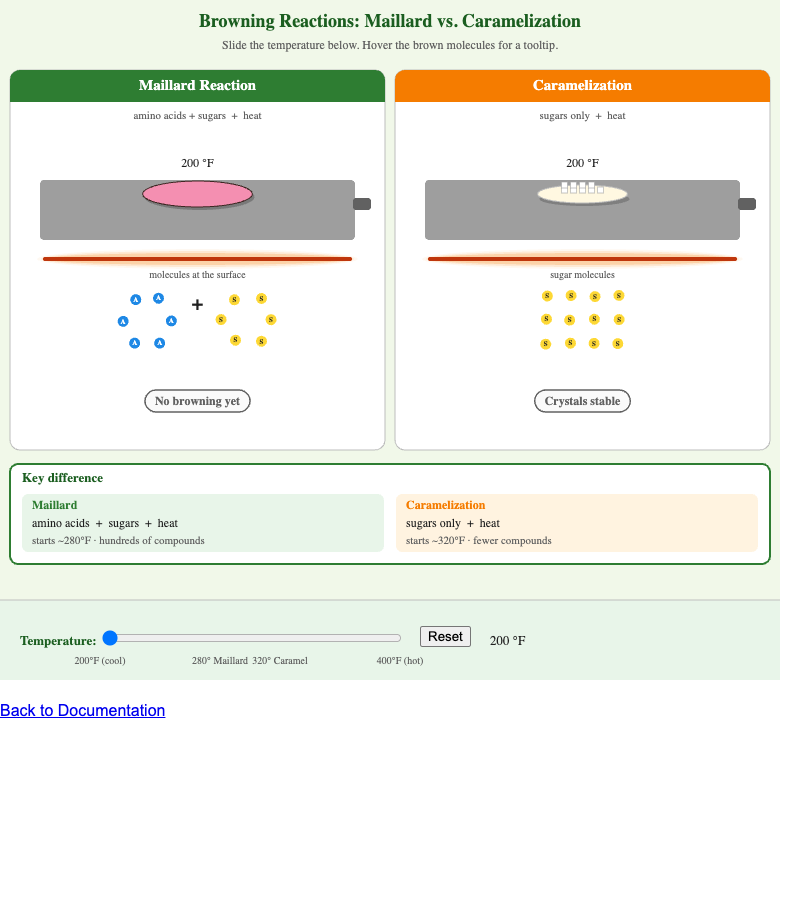
Step through the two great browning reactions side by side. Compare reactants, temperatures, and the very different flavors they produce.
-
Microwave vs. Conventional Oven Heating
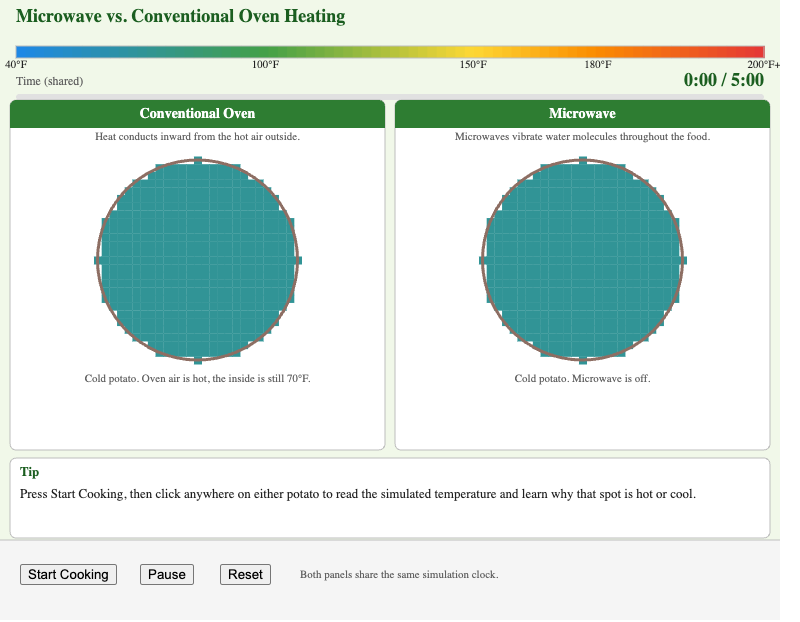
See exactly where heat is generated inside a piece of food in a microwave versus a conventional oven, and why the two cook so differently.
-
Multisensory Flavor Perception Map
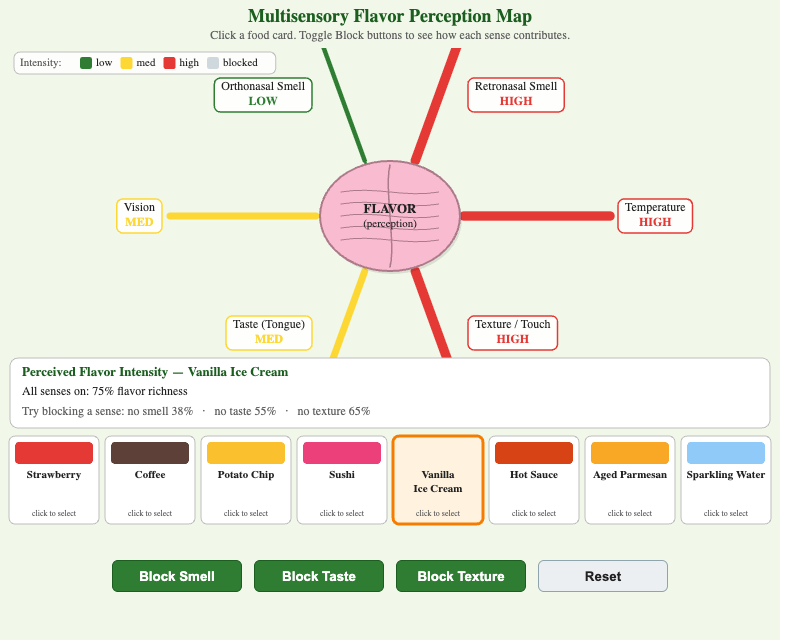
Toggle taste, smell, sight, sound, and texture inputs to see how each sense combines to produce the unified experience we call "flavor."
-
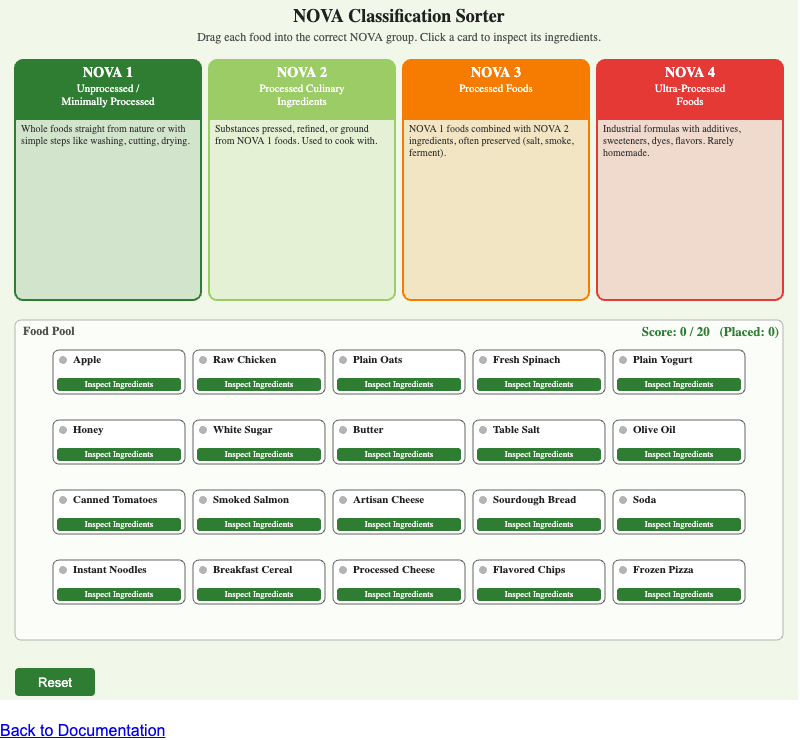
Drag foods into NOVA groups 1 through 4 and learn what really separates whole foods from ultra-processed products.
-
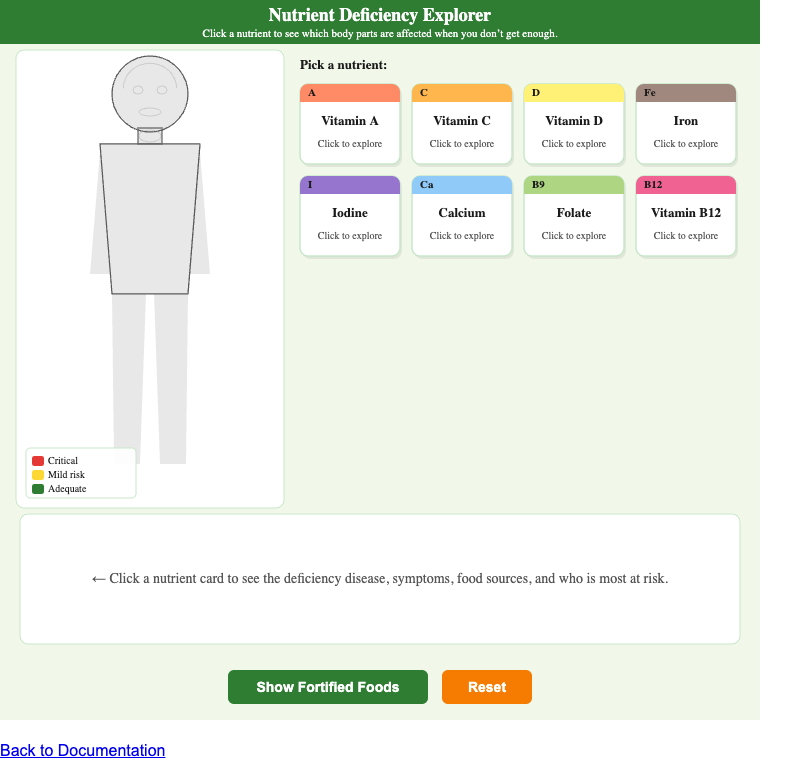
Match each micronutrient to the deficiency disease it prevents and the foods that supply it — vitamin C and scurvy, iron and anemia, and more.
-
Peptide Bond Formation Animator
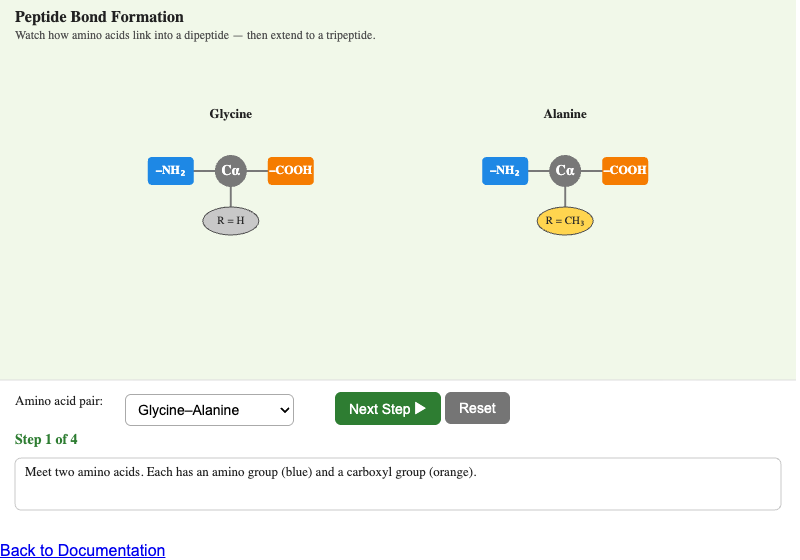
Step through the condensation reaction that joins two amino acids into a peptide, releasing a water molecule. The first step toward building any protein.
-
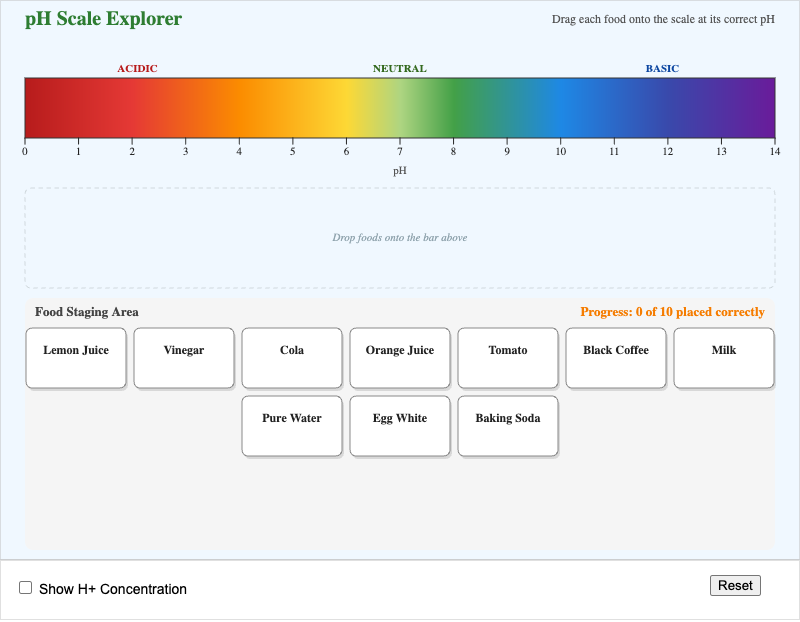
Place common foods on the pH scale and connect acidity to taste — sour foods are acidic, bitter foods often basic, and water sits in the middle.
-
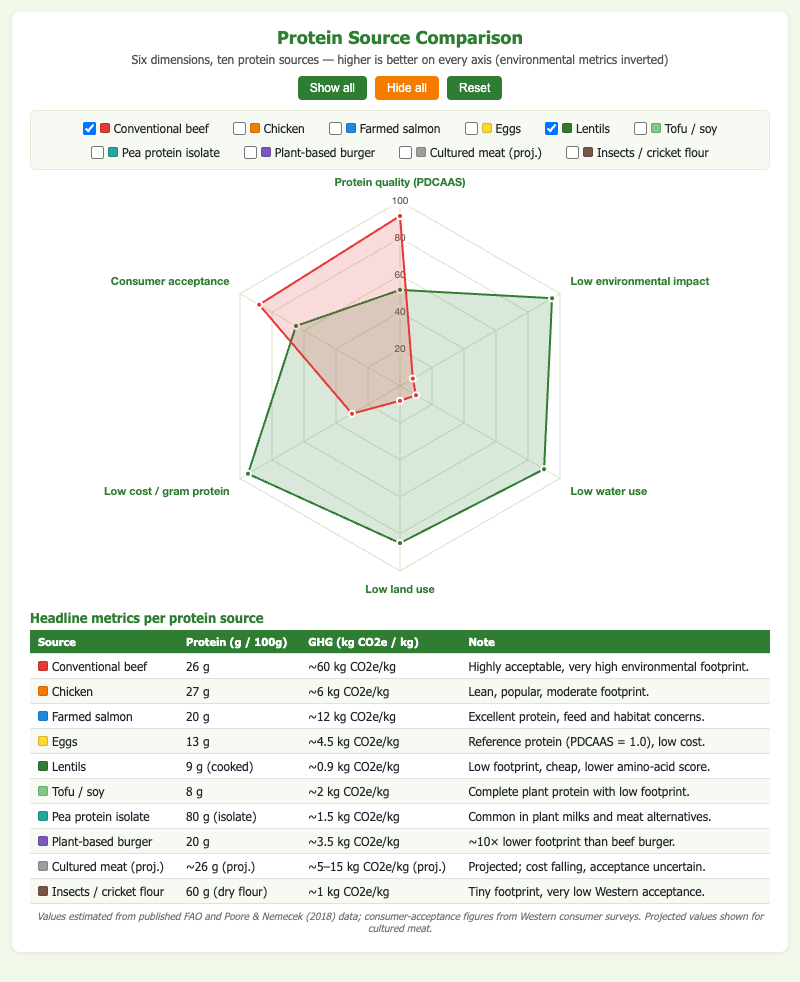
Compare beef, chicken, fish, tofu, beans, and insects across protein content, land use, water use, and emissions to evaluate real-world food tradeoffs.
-
Saturated vs. Unsaturated Fat Explorer
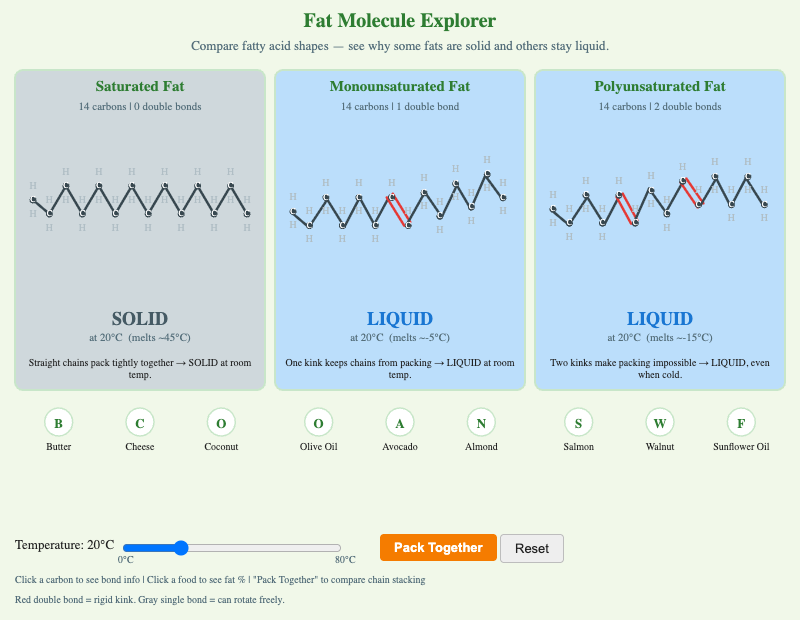
Compare straight saturated fatty acid chains against kinked unsaturated chains and discover why butter is solid while olive oil is liquid.
-
Scientific Method Steps Explorer
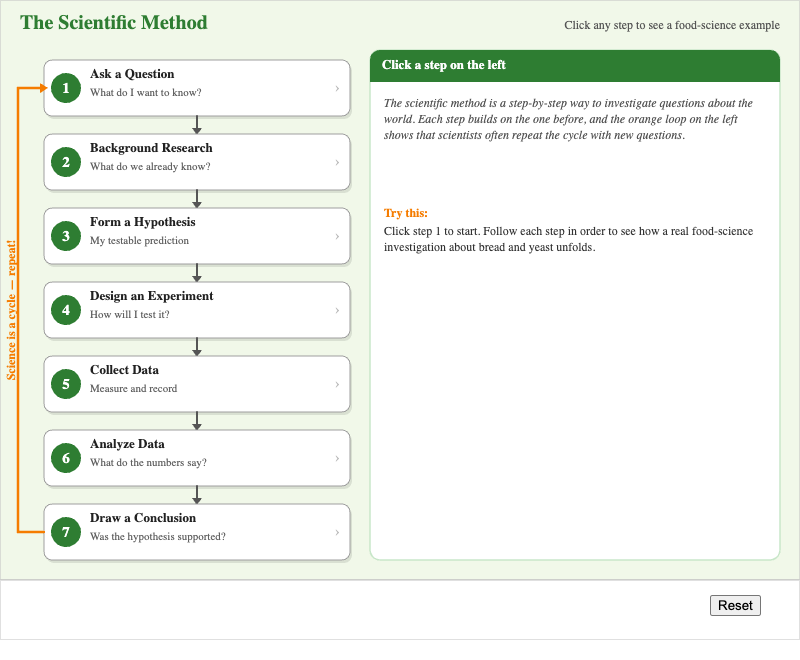
Click through the seven steps of the scientific method using food science examples, from asking a question to communicating results.
-
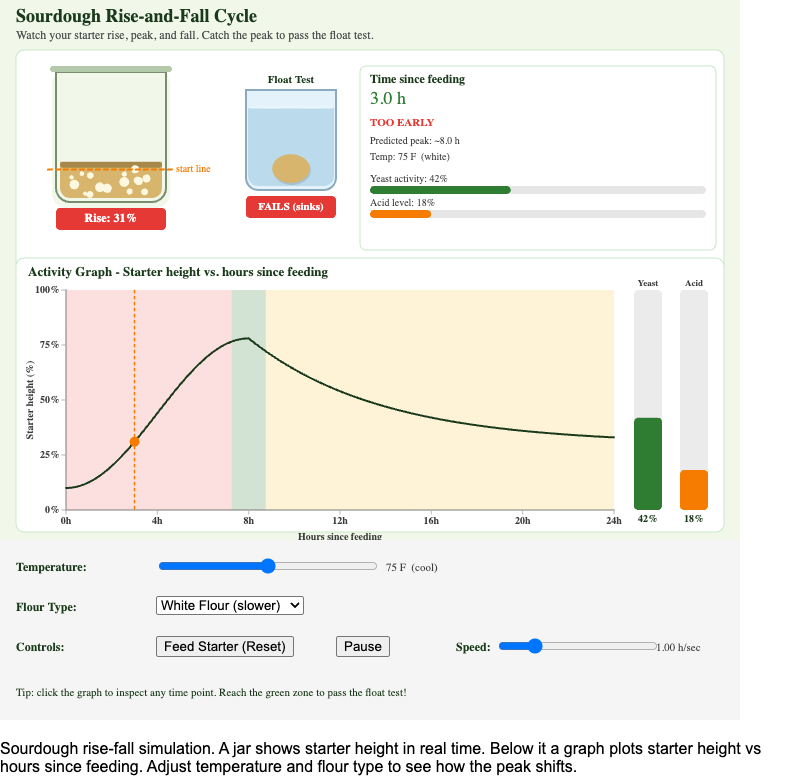
Track a sourdough starter as it rises, peaks, and collapses. Learn to read the cycle so you can time your bake to peak yeast activity.
-
Temperature Danger Zone Visualizer
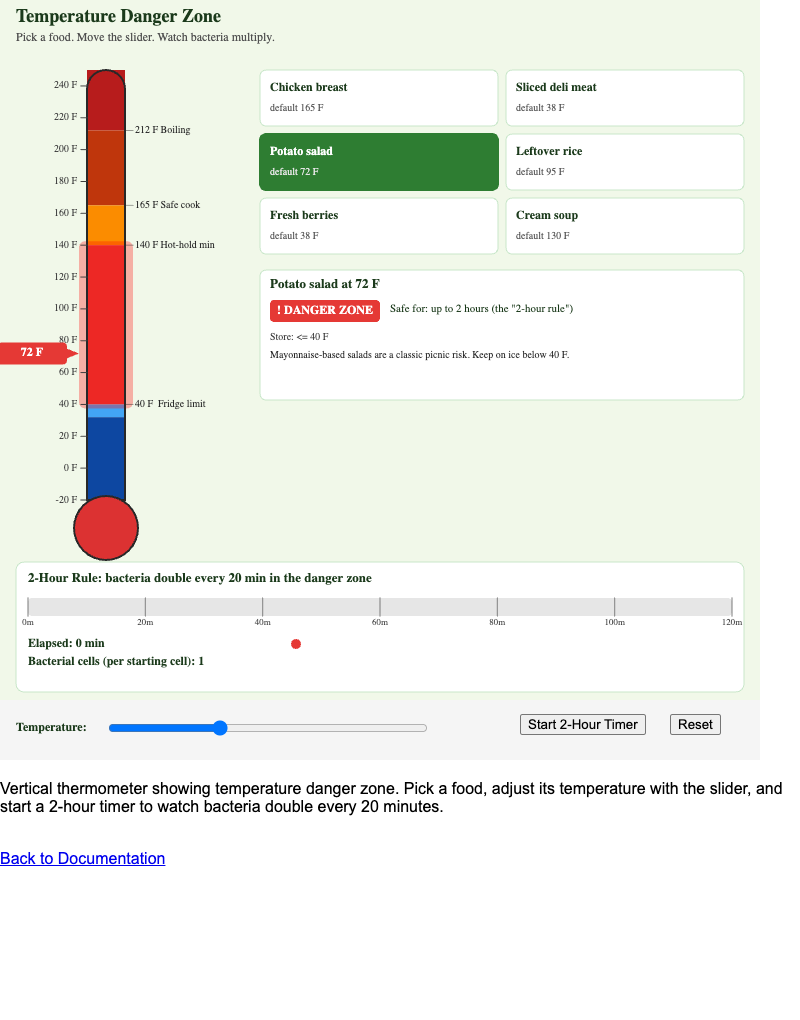
Move food through cold storage, the 40–140 °F danger zone, and safe cooking temperatures. See how time and temperature drive bacterial growth.
-
Three Modes of Heat Transfer in Cooking
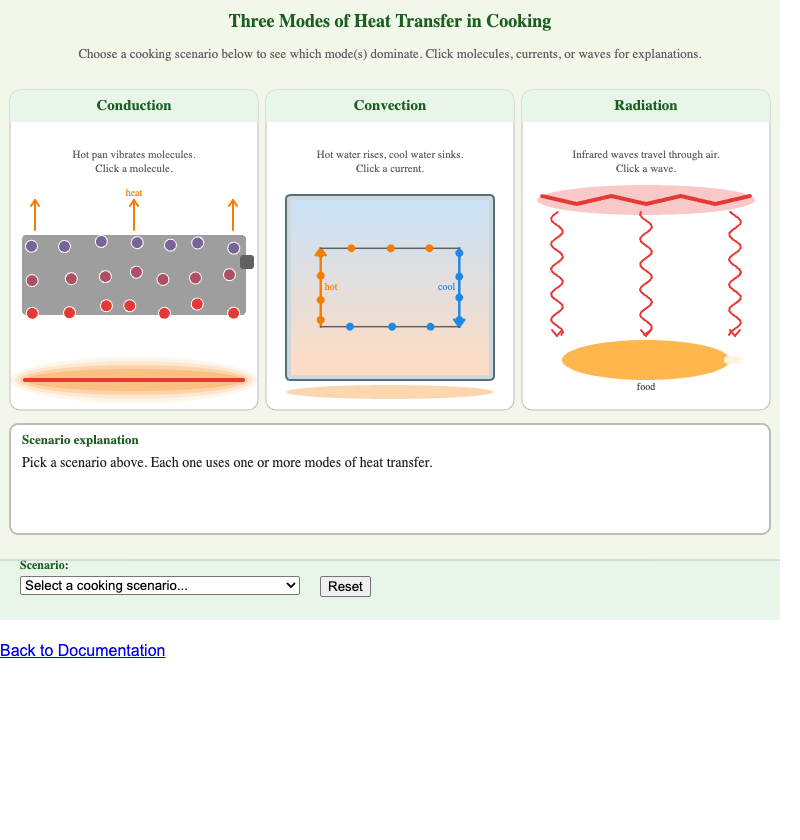
Identify conduction, convection, and radiation in real cooking scenarios — and see at the molecular level what makes each one tick.
-
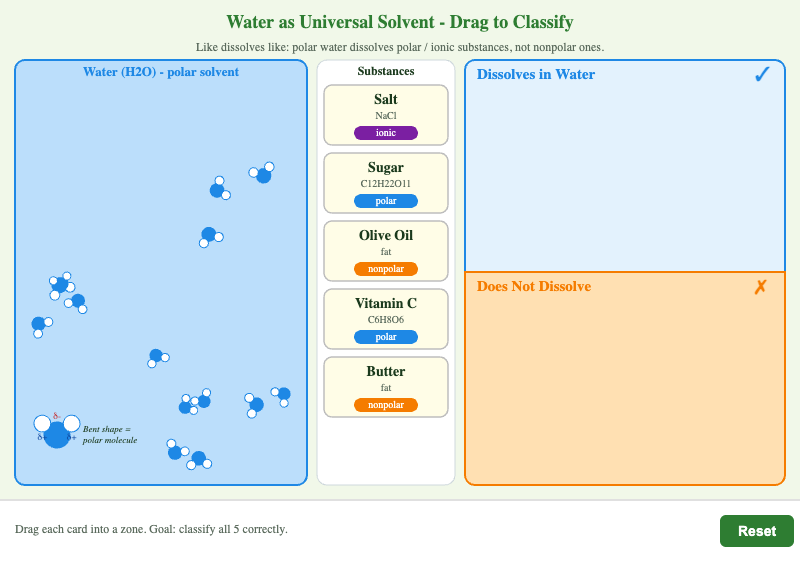
Drop polar, ionic, and nonpolar substances into water and watch which ones dissolve. The molecular reason oil and water just won't mix.
-
What Happens Inside a Loaf as It Bakes
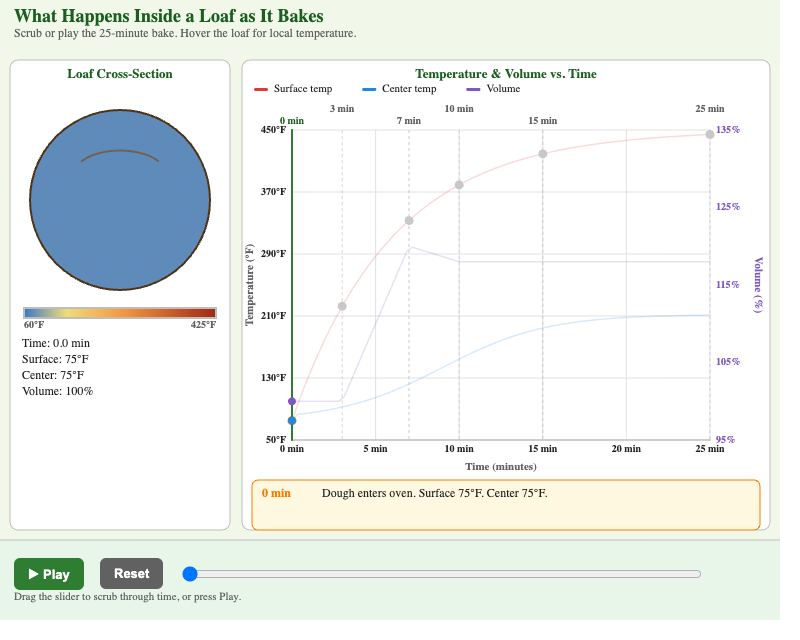
A timeline of the chemical and physical changes inside a loaf of bread as the oven temperature climbs — oven spring, starch gelation, crust browning, and more.
-
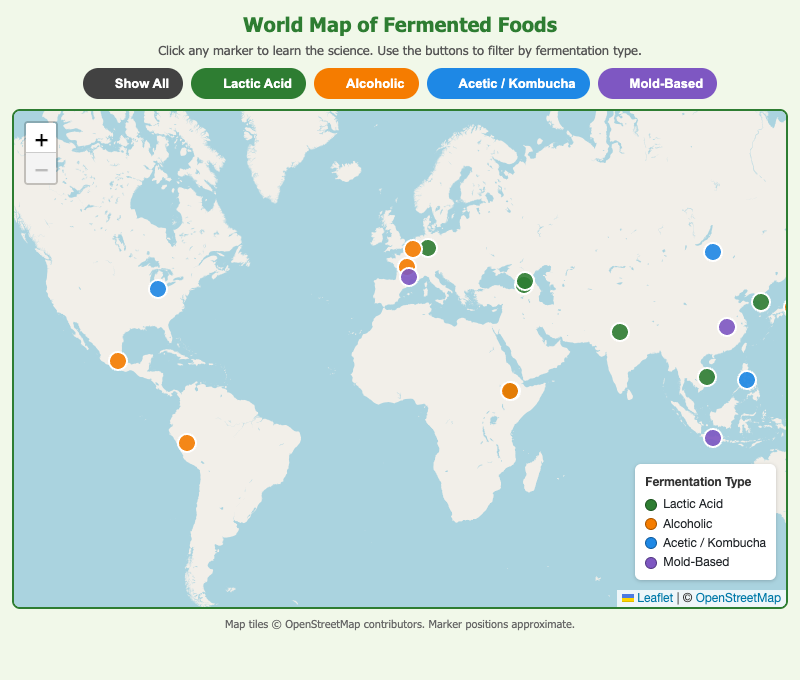
A Leaflet world map of fermented food traditions — kimchi, miso, kefir, sauerkraut, injera, and more — grouped by the fermentation pathway each uses.