Interactive MicroSims
These interactive simulations let you explore the mathematical concepts from each chapter hands-on. Click any title to launch the MicroSim.
Total: 28 MicroSims across 13 chapters
Chapter 1: Algebra Foundations
-
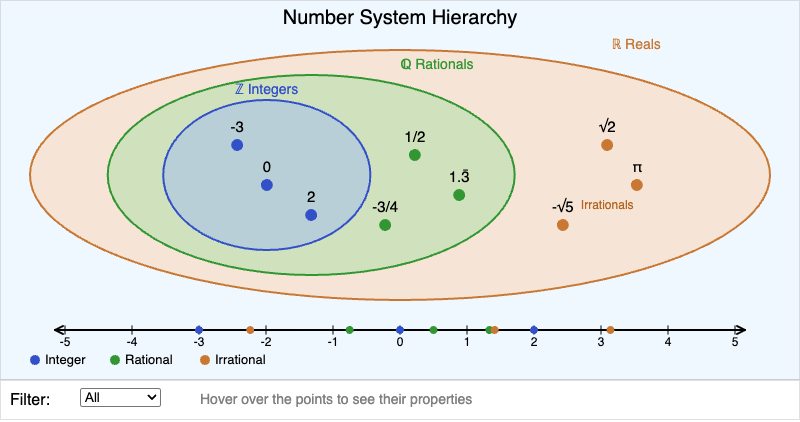
Visualize nested number systems — integers, rationals, irrationals — with an interactive number line and classification tooltips.
-
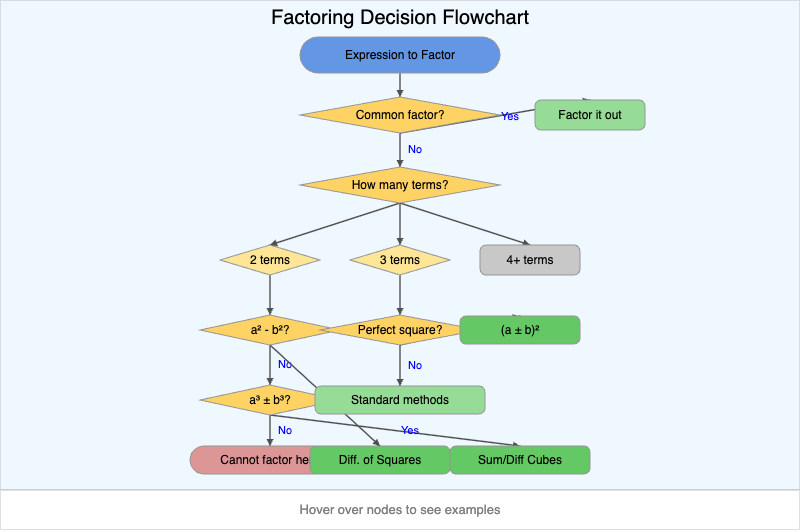
Interactive flowchart guiding you through choosing the right factoring technique for any expression.
-
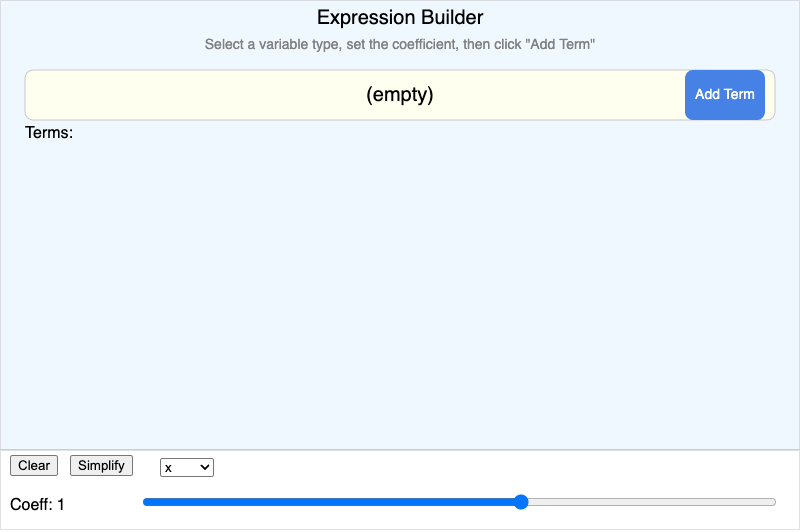
Build algebraic expressions from term tiles and watch them simplify in real time.
Chapter 2: Relations and Functions
-
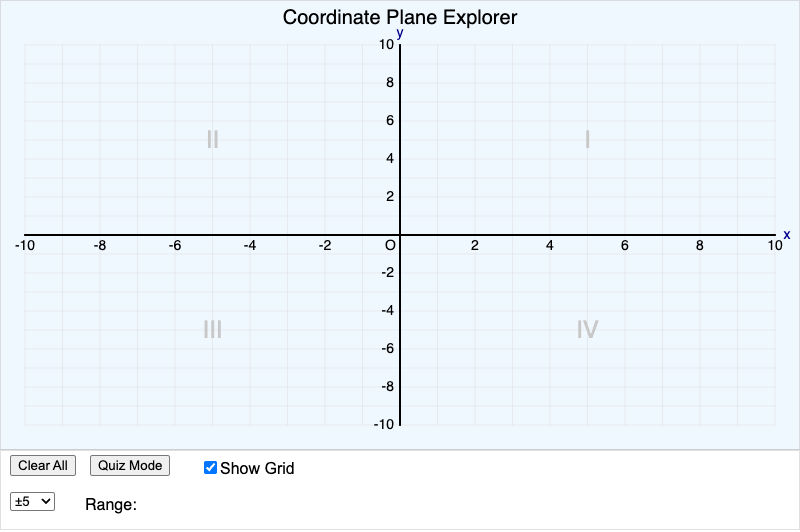
Click to place points on the coordinate plane. Quiz mode challenges you to find specific coordinates.
-
Function vs Non-Function Mapping
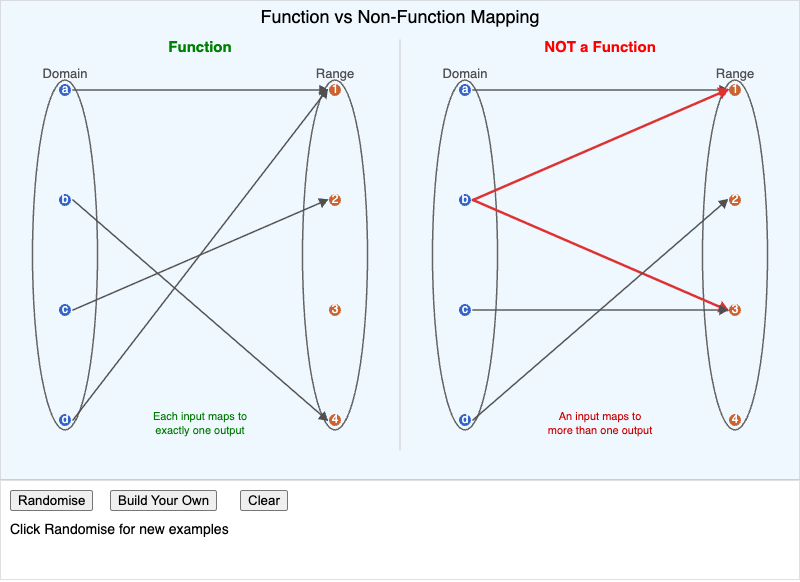
Side-by-side mapping diagrams showing why some relations are functions and others aren't.
-
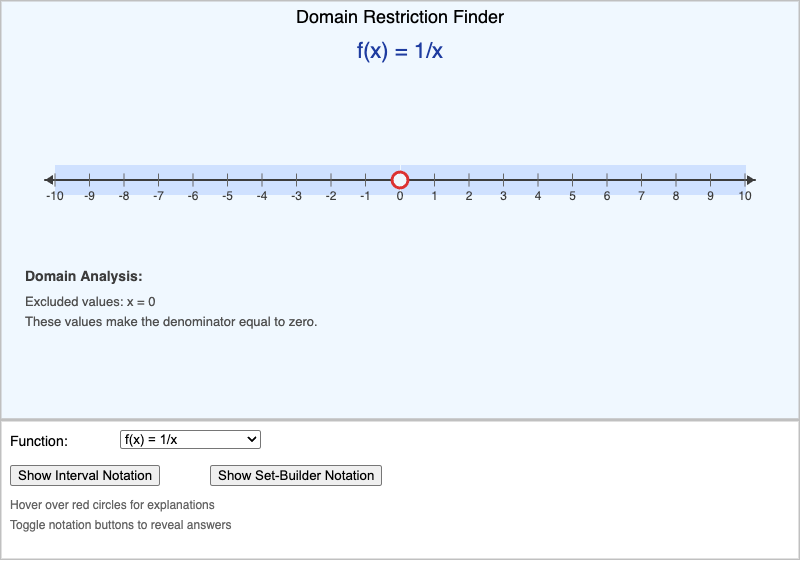
Explore how division by zero and square roots create domain restrictions on a visual number line.
-
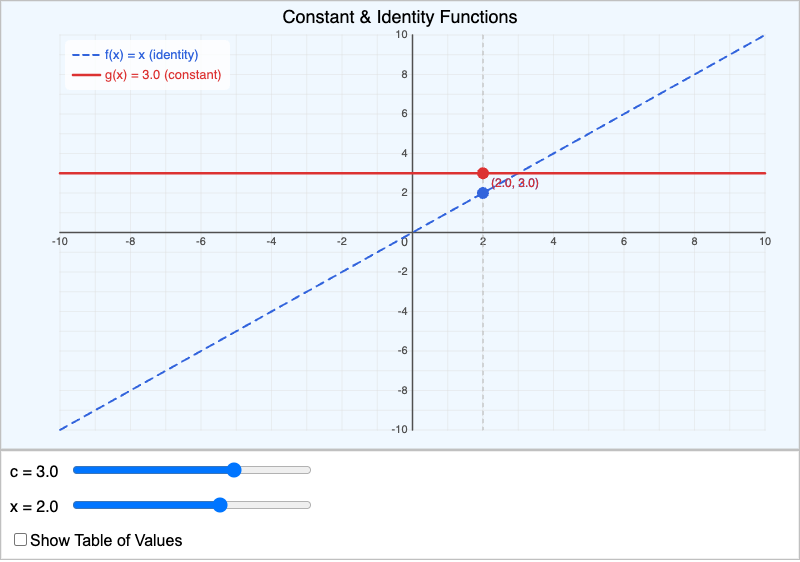
Compare the constant function and identity function with adjustable parameters and a trace tool.
-
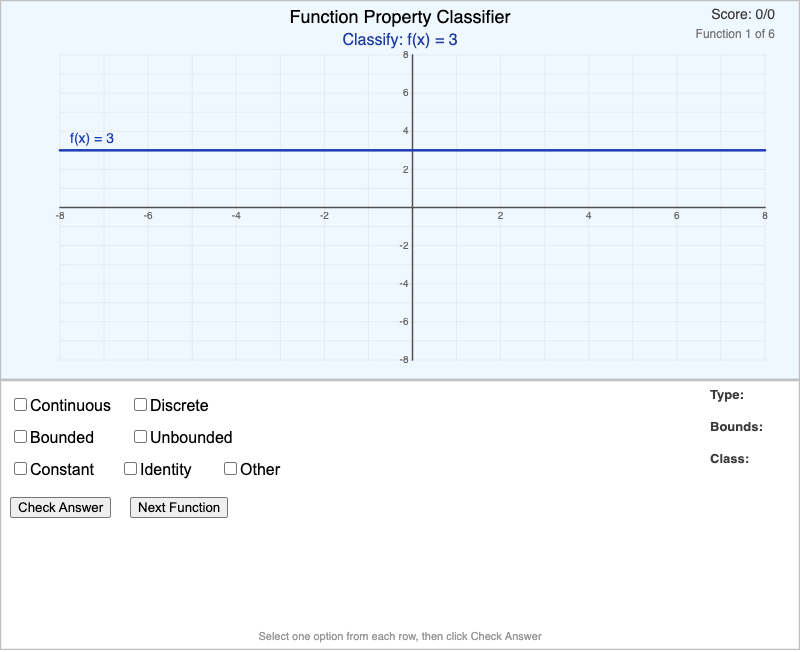
Classify functions as continuous/discrete, bounded/unbounded from their graphs. Quiz with scoring.
Chapter 3: Graphing and Key Features
-
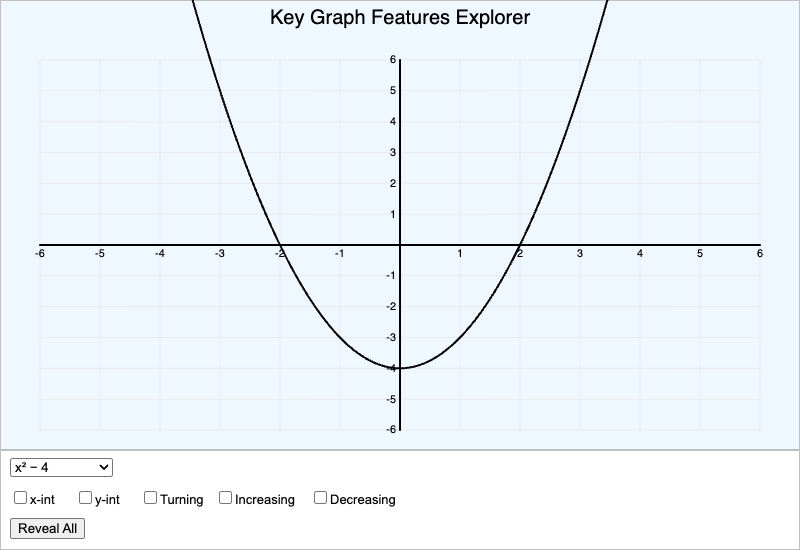
Toggle intercepts, turning points, and increasing/decreasing intervals on function graphs.
-
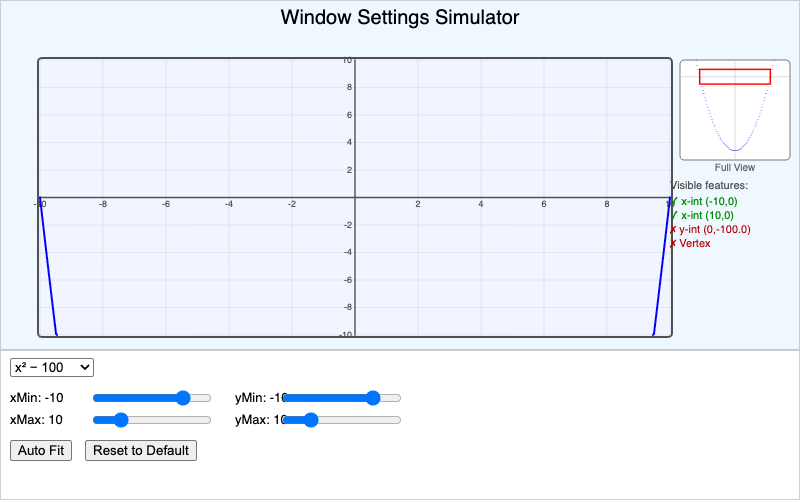
Learn why GDC window settings matter by adjusting the view and seeing which features are visible.
-
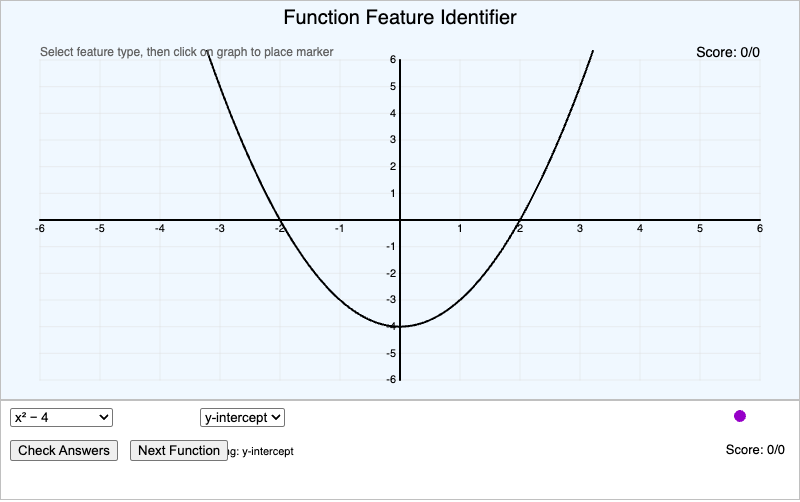
Click on graphs to identify intercepts, maxima, minima, and inflection points. Scored quiz.
Chapter 4: Linear Functions
-
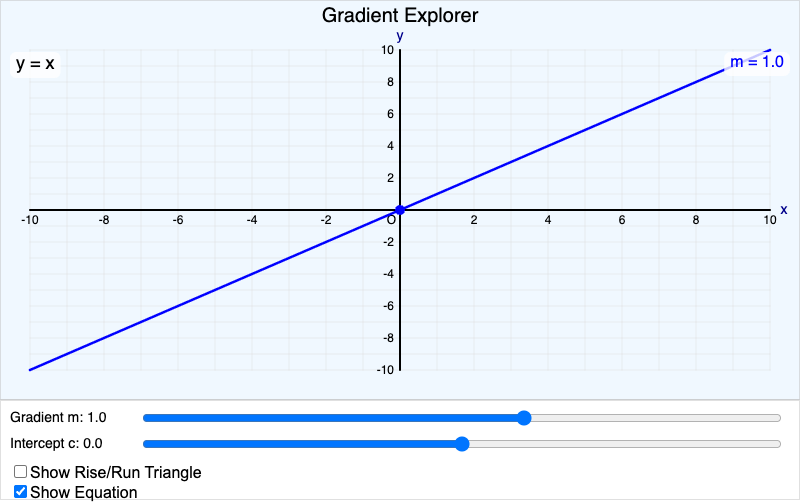
Adjust the gradient and y-intercept with sliders and see the rise/run triangle update in real time.
-
Simultaneous Equations Visualizer
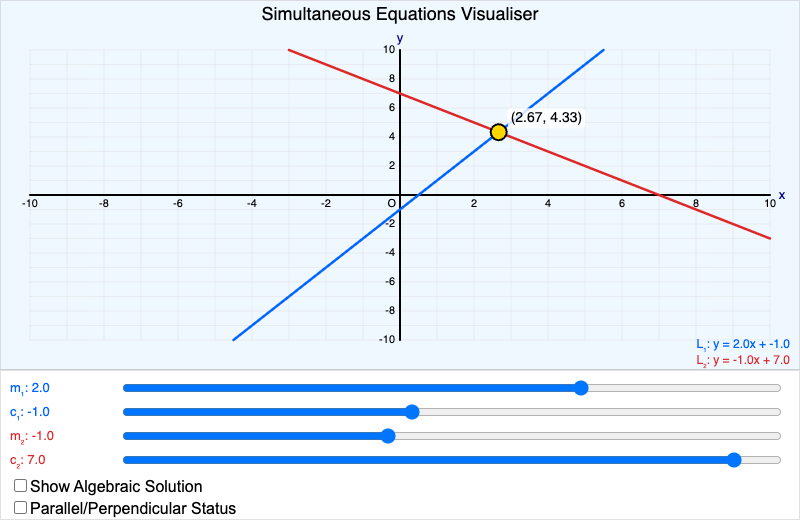
Graph two lines and find their intersection. Detects parallel and perpendicular relationships.
-
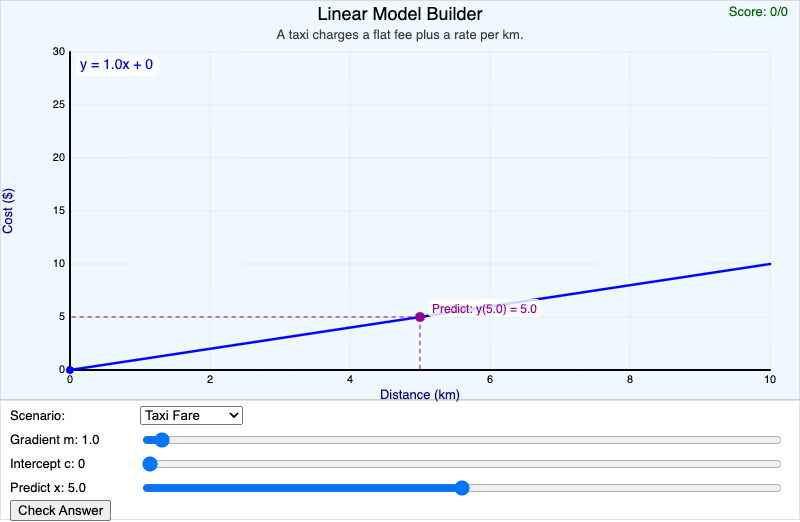
Match real-world scenarios to linear models by choosing the right gradient and y-intercept.
Chapter 5: Quadratic Functions
-
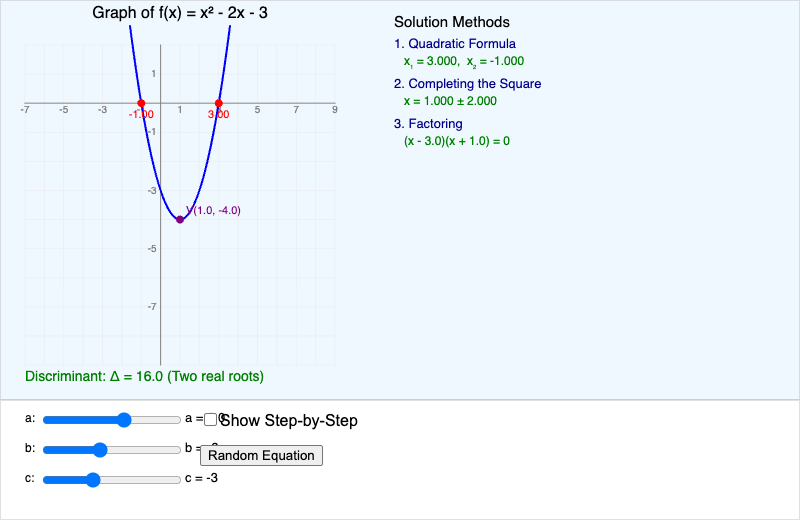
See three solution methods side by side — factoring, completing the square, and the quadratic formula.
-
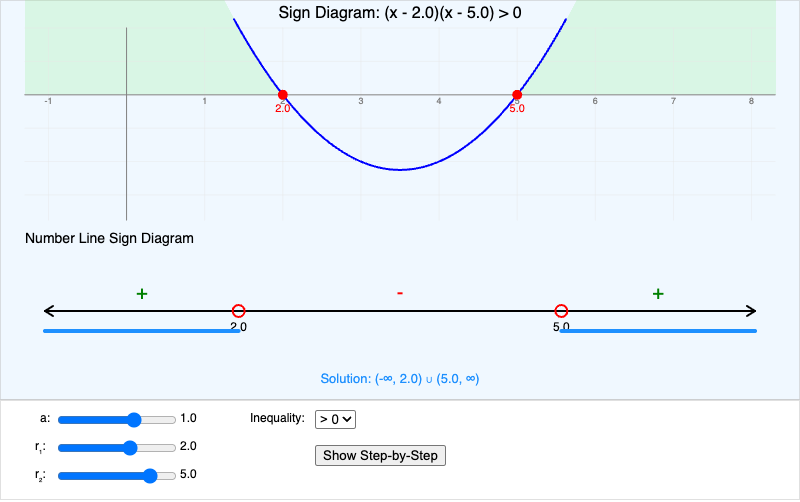
Build sign diagrams for quadratic inequalities with the parabola and number line aligned.
-
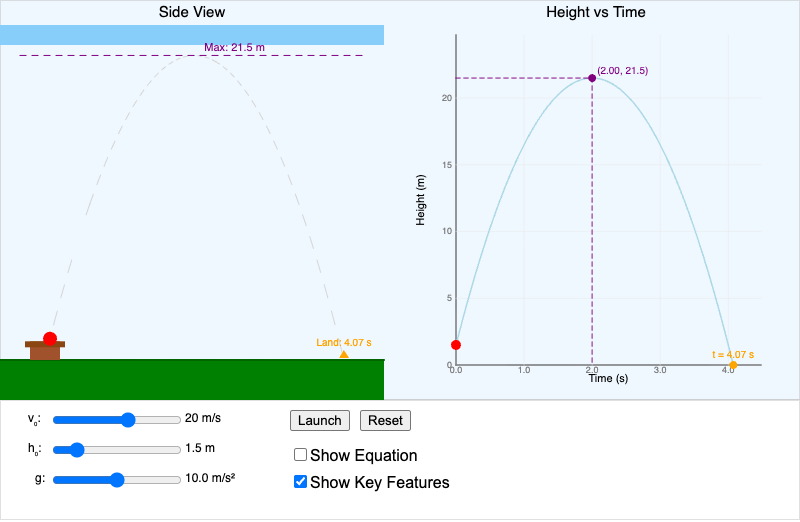
Launch a projectile and watch the parabolic trajectory with adjustable velocity, height, and gravity.
Chapter 6: Inverse and Composite Functions
-
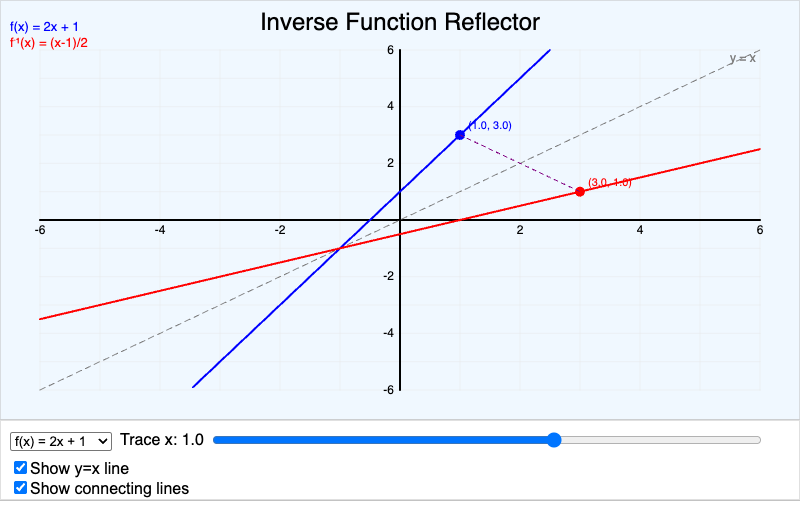
See a function and its inverse as reflections over the line y = x with traced corresponding points.
-
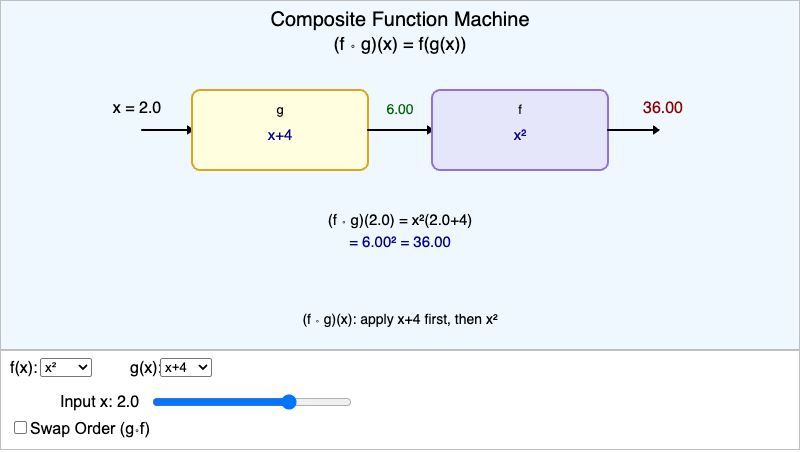
Feed inputs through two function machines and see how composition order changes the result.
Chapter 7: Exponential Functions
-
Exponential Growth & Decay Explorer
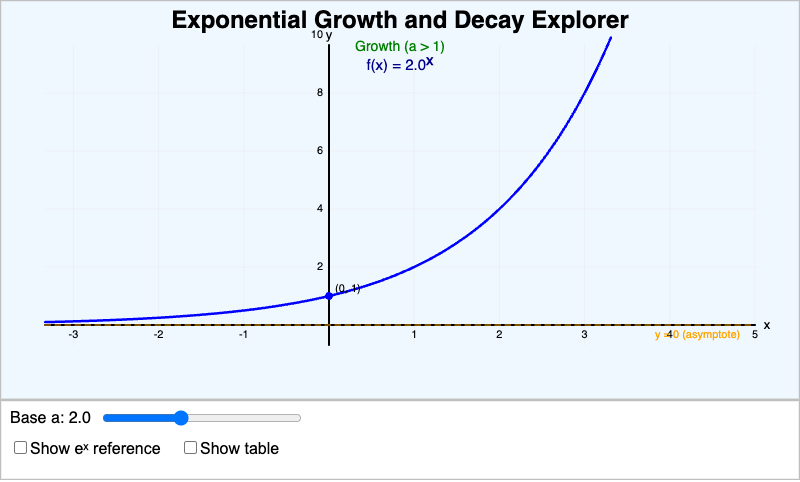
Adjust the base to see exponential growth morph into decay, with the transition at a = 1.
-
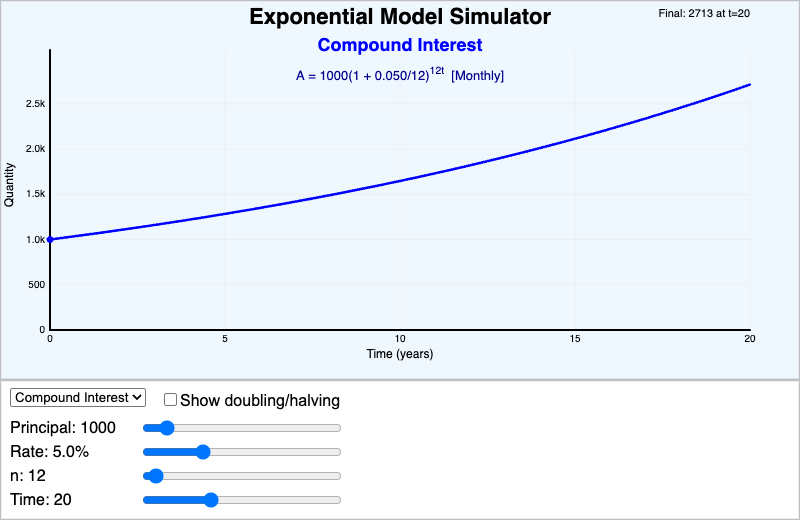
Explore compound interest, population growth, and half-life models with adjustable parameters.
Chapter 8: Logarithmic Functions
-
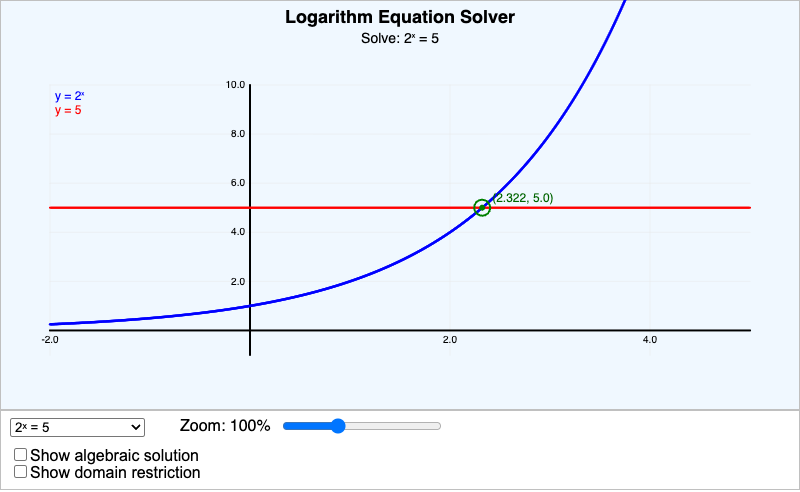
Solve exponential and logarithmic equations graphically — see both sides plotted with the intersection.
Chapter 9: Polynomial Functions
-
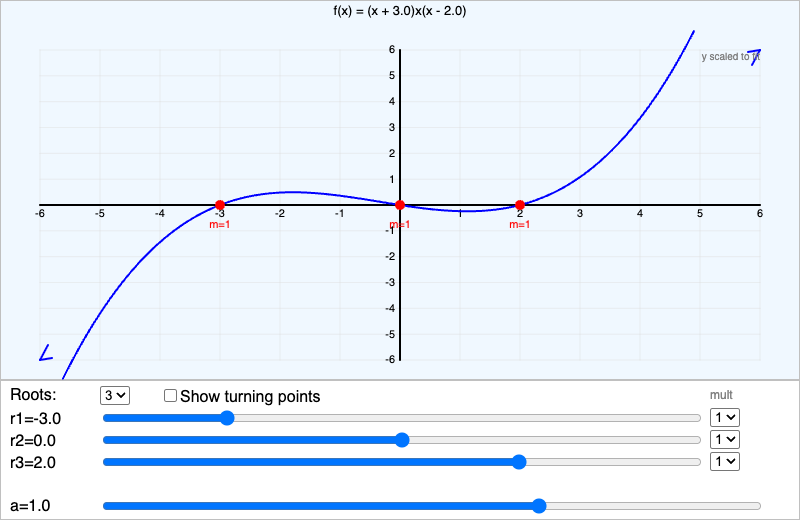
Build polynomials by setting roots and multiplicities. See how the graph crosses or bounces.
Chapter 10: Rational Functions
-
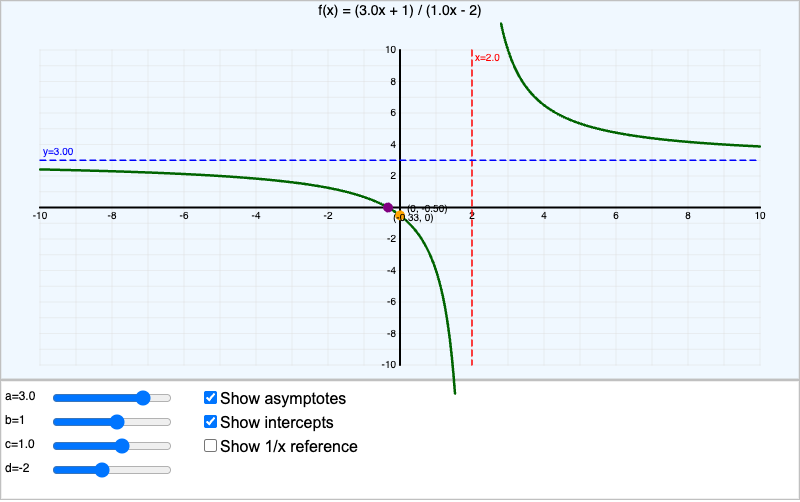
Graph (ax+b)/(cx+d) with adjustable parameters. See asymptotes, intercepts, and the hyperbola shape.
Chapter 11: Function Classifications
-
Modulus Transformation Explorer
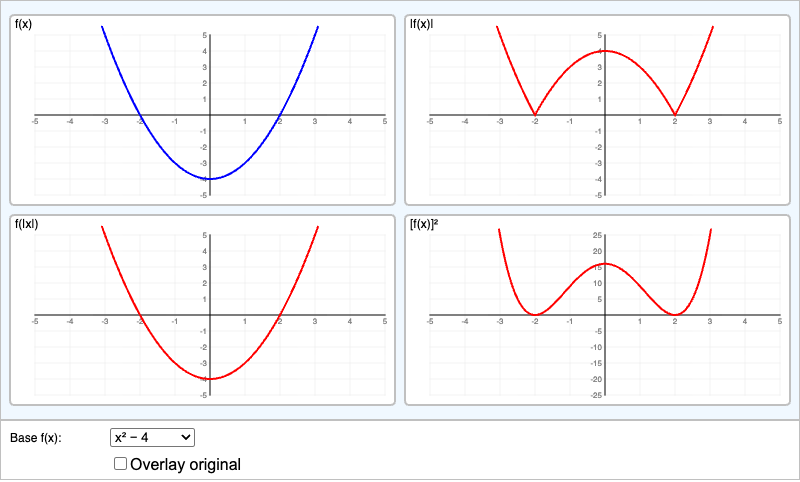
Compare |f(x)|, f(|x|), and [f(x)]² side by side in a 2×2 grid for multiple base functions.
Chapter 12: Transformations
-
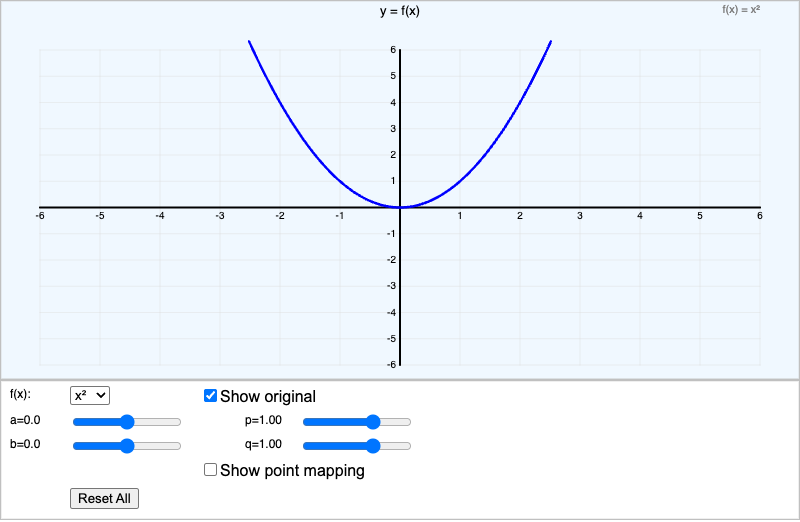
Apply translations, reflections, and stretches to any base function with four parameter sliders.
Chapter 13: Modeling and Applications
-
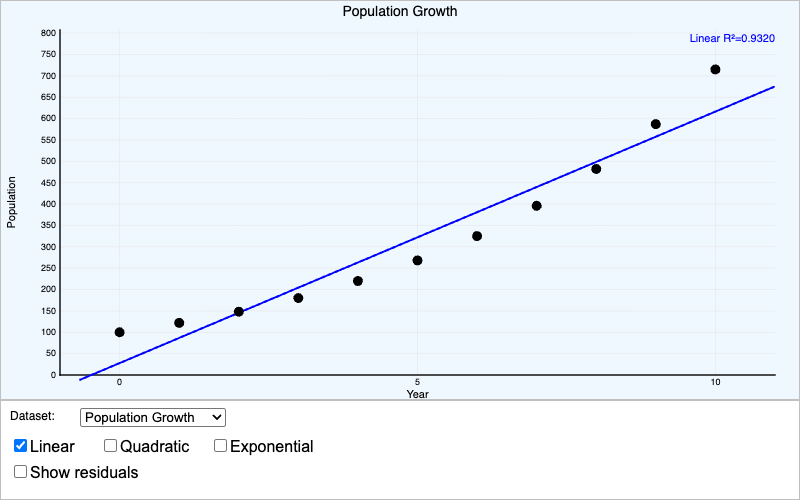
Fit linear, quadratic, and exponential regression curves to real-world datasets. Compare R² values.
Learning Tools
-
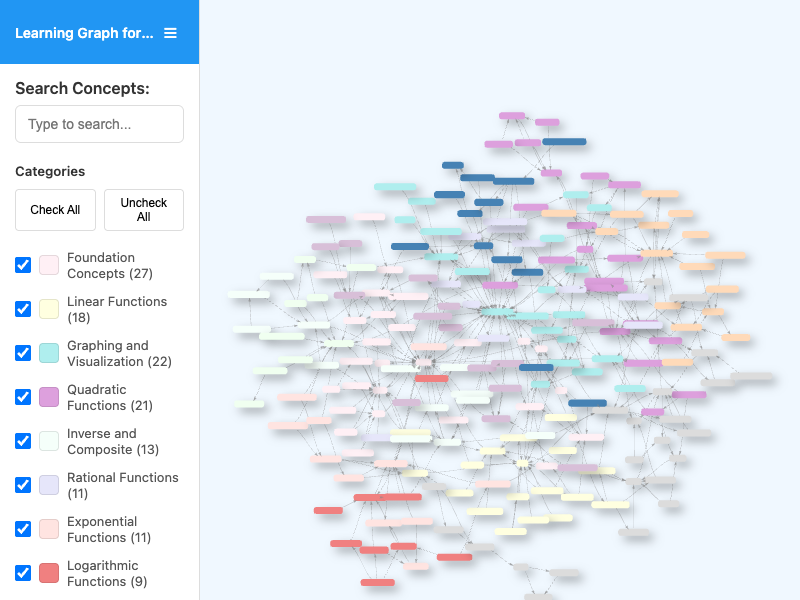
Explore the interactive concept dependency graph for the entire course.