List of MicroSims for Hydroponics
Interactive Micro Simulations to help students learn hydroponics fundamentals — from plant biology and nutrient chemistry to system design and data analysis.
-
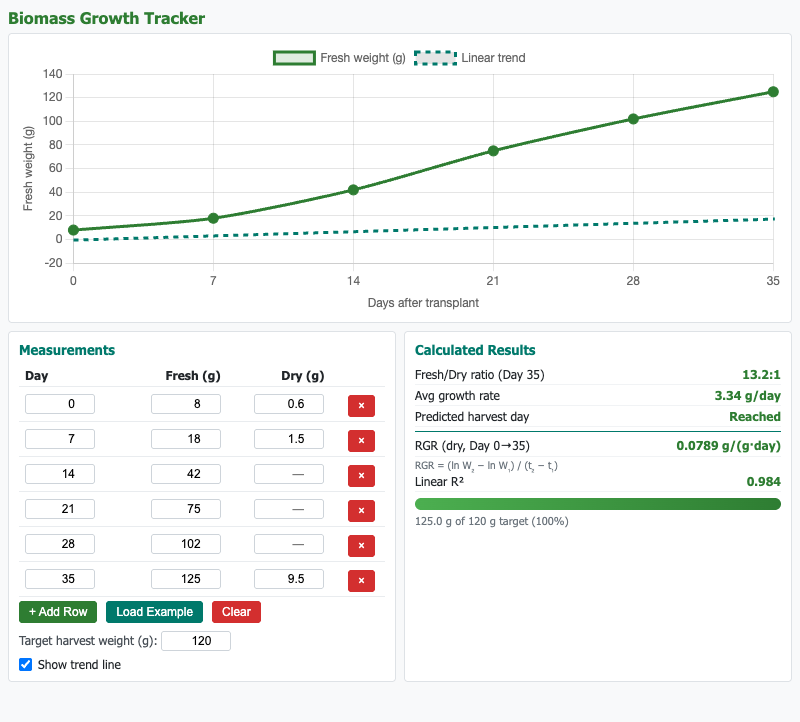
Enter plant growth measurements to plot growth curves and calculate relative growth rate and fresh-to-dry weight ratio over a simulated crop cycle.
-
Commercial Vertical Farm Comparison
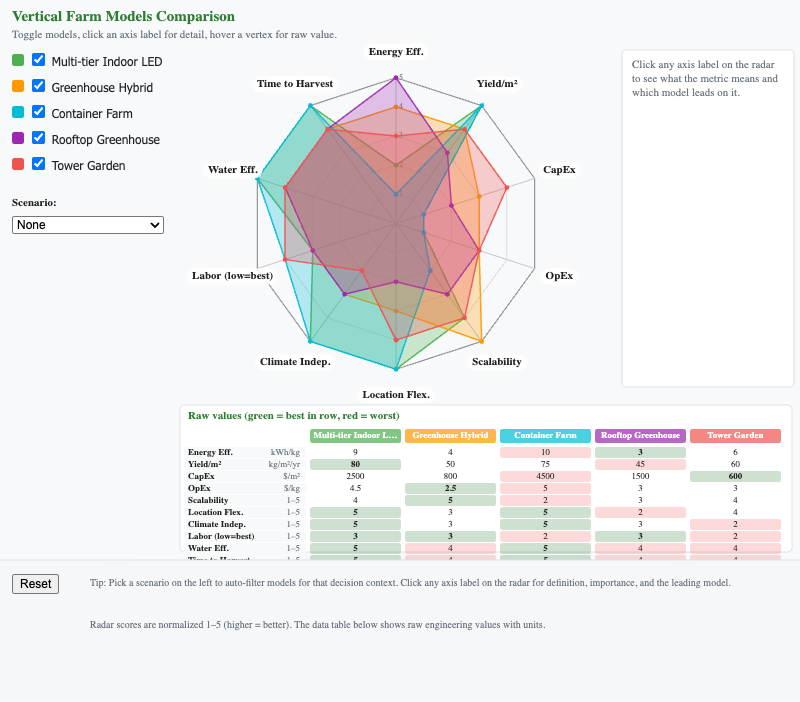
Radar chart comparing five vertical farming models across 10 dimensions including energy efficiency, yield per floor area, CapEx, and location flexibility.
-
DIY Build Cost and Complexity Selector
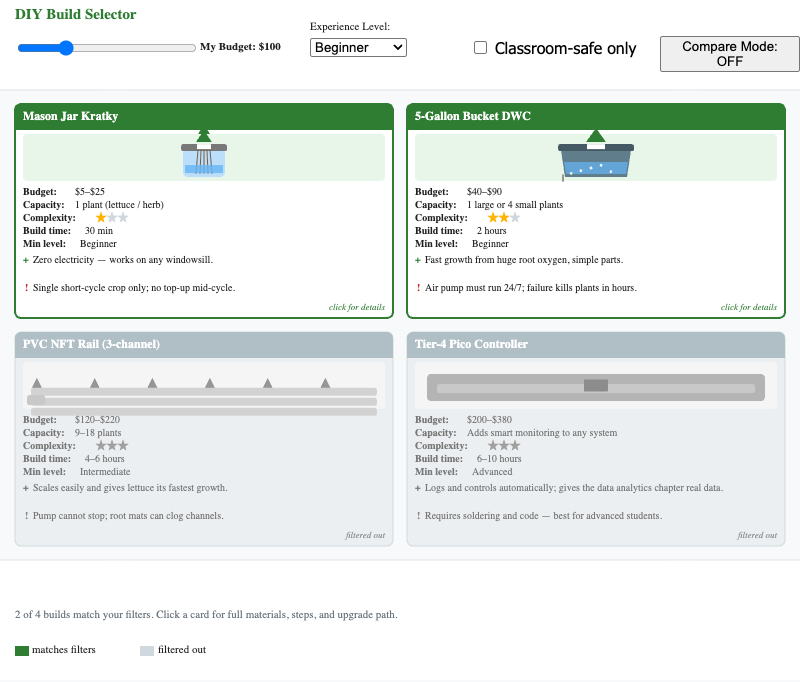
Filter four DIY hydroponic builds by budget and experience level to find the best starting project, with component lists and safety ratings for each.
-
EC and pH Monitor Over a Crop Cycle
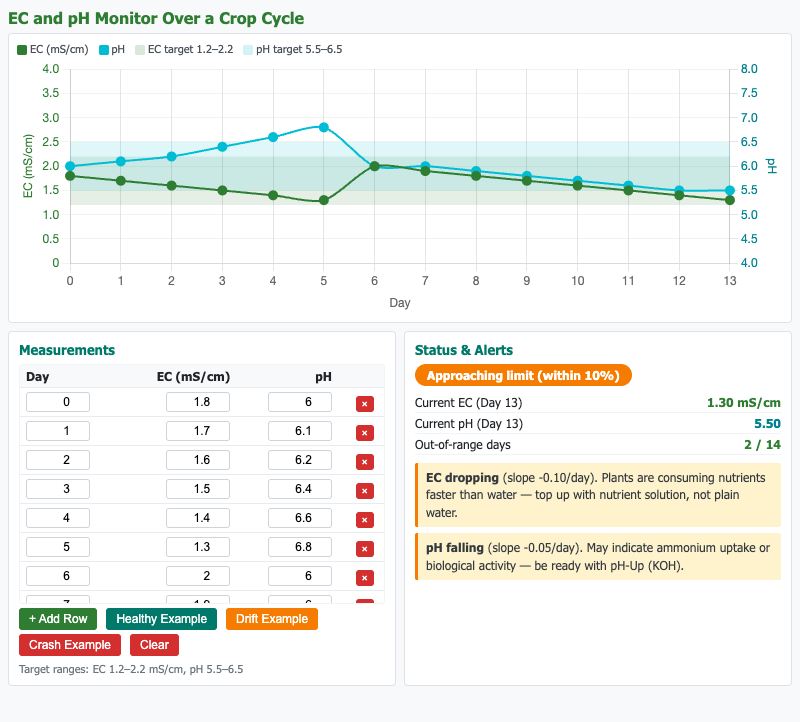
Dual-axis chart showing how EC and pH evolve over a 35-day crop cycle with interactive management actions like topping up water and adding pH adjusters.
-
Failure Mode Analysis Decision Tree
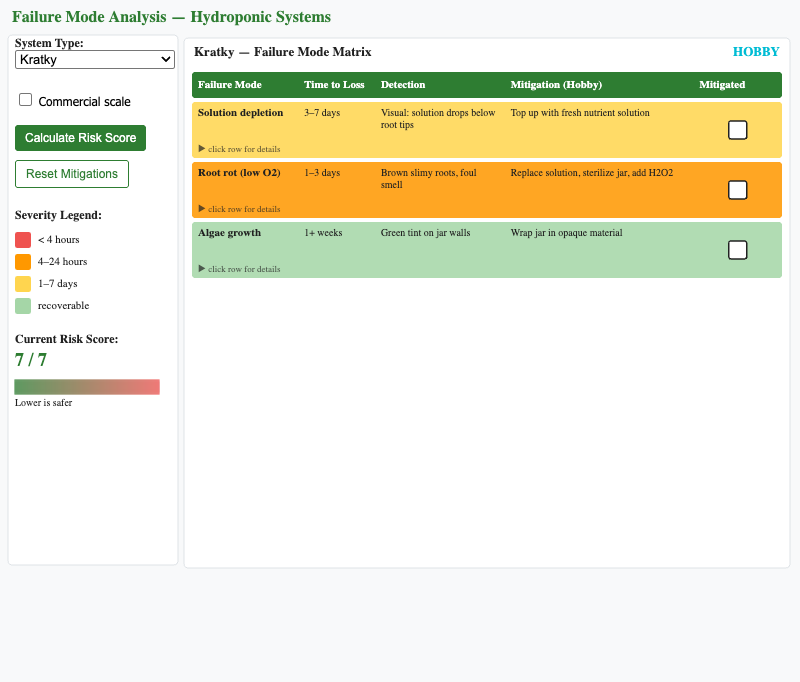
Color-coded failure mode matrix for six hydroponic system types, showing time-to-crop-loss, detection method, and recommended mitigation for each failure.
-
Growing Media Properties Comparison
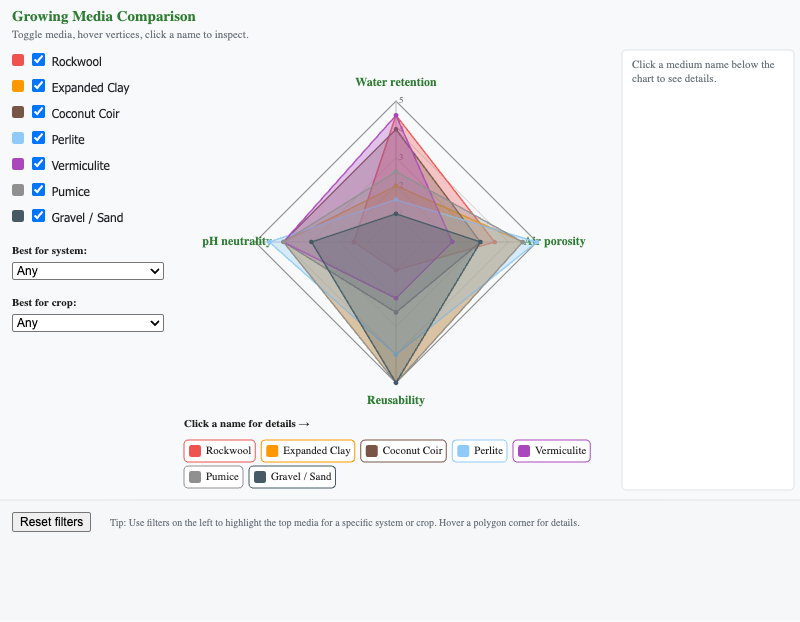
Radar chart comparing seven growing media across water retention, air porosity, reusability, and pH neutrality with filters by system type and crop.
-
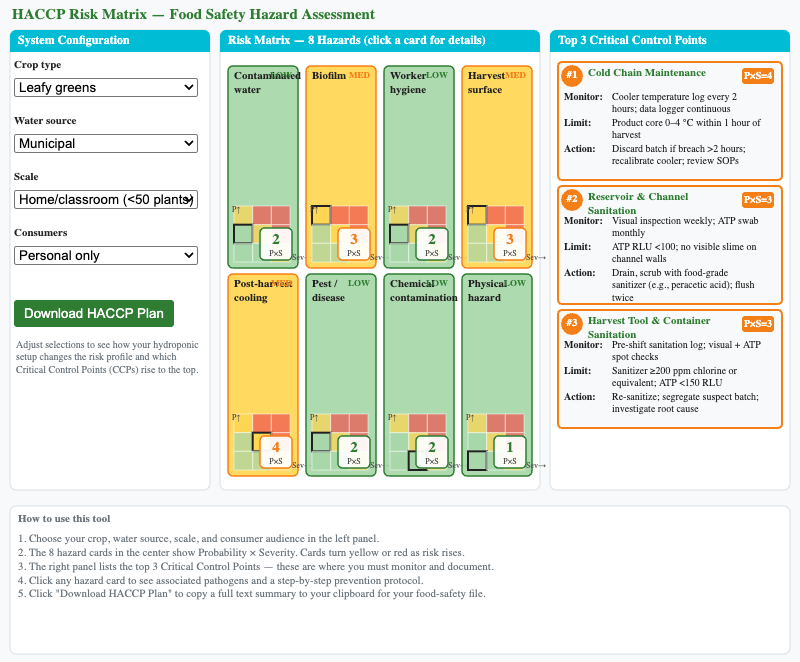
Identify Critical Control Points and corrective actions for your hydroponic setup by selecting crop type, water source, scale, and consumer group.
-
Hardware Interface Architecture
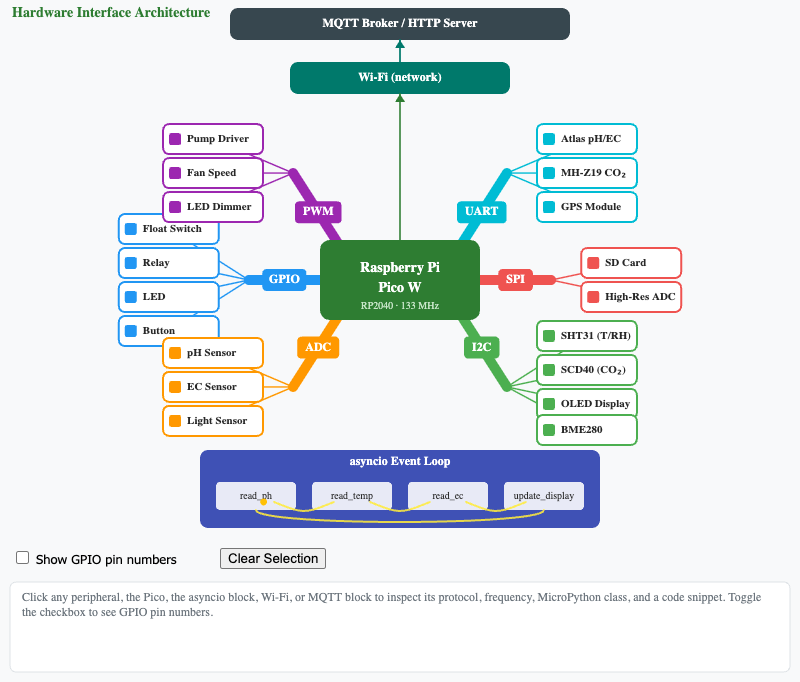
Architecture diagram showing how GPIO, ADC, PWM, I2C, SPI, and UART protocols connect a Raspberry Pi Pico W to hydroponic sensors and actuators.
-
History of Hydroponics Timeline
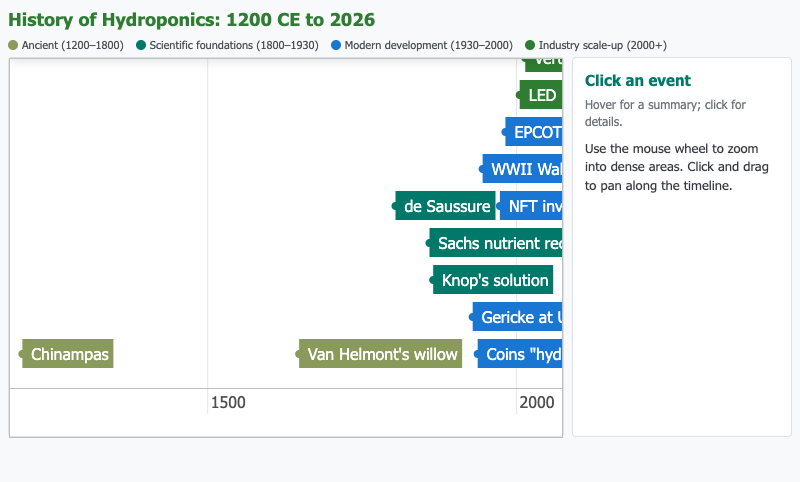
Scrollable timeline from 1200 CE to today with clickable milestones tracing the history of soilless growing from Aztec chinampas to modern hydroponics.
-
Hydroponic Farm Financial Model Builder
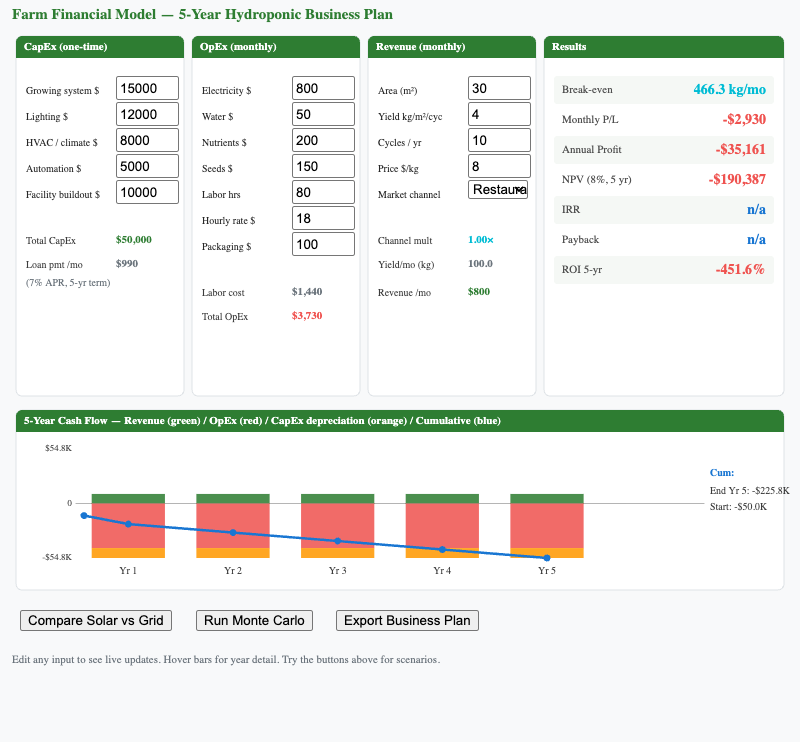
Enter CapEx, OpEx, and revenue inputs to calculate break-even, NPV, IRR, payback period, and a 5-year cash flow chart for a hydroponic operation.
-
Hydroponic Systems Side-by-Side Comparison
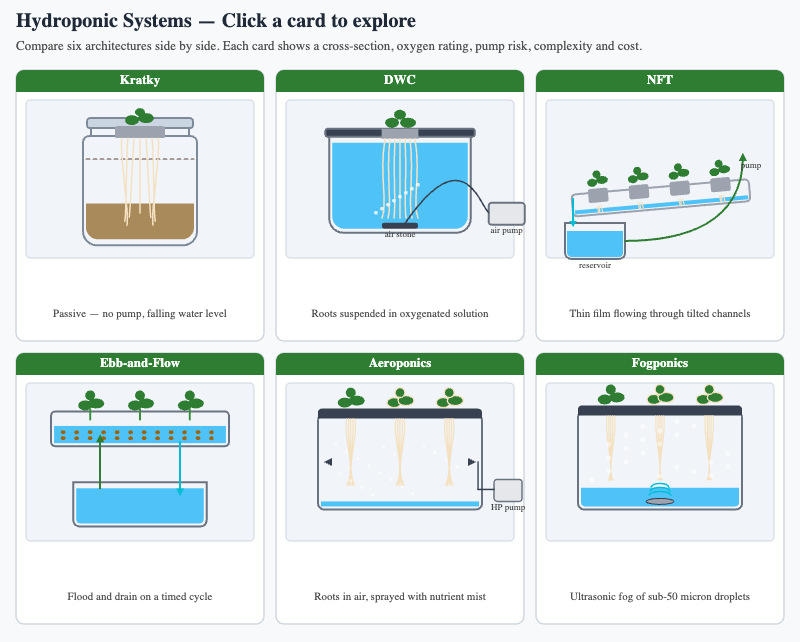
Clickable gallery of six hydroponic system cross-sections (Kratky, DWC, NFT, Ebb-and-Flow, Aeroponics, Drip) with trade-off comparisons on five dimensions.
-
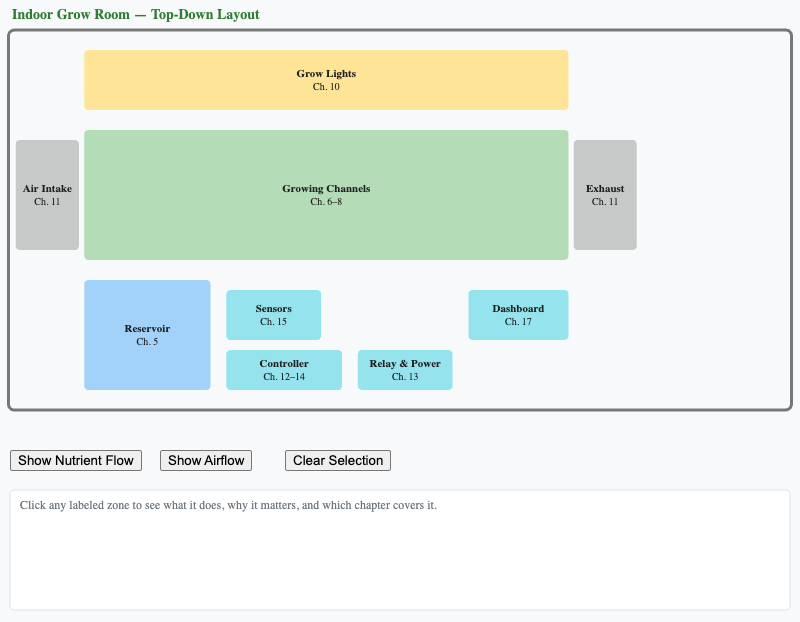
Bird's-eye view of a grow room with clickable zones identifying each component and linking to the chapters that cover it in depth.
-
Interactive Mulder's Chart — pH and Nutrient Availability
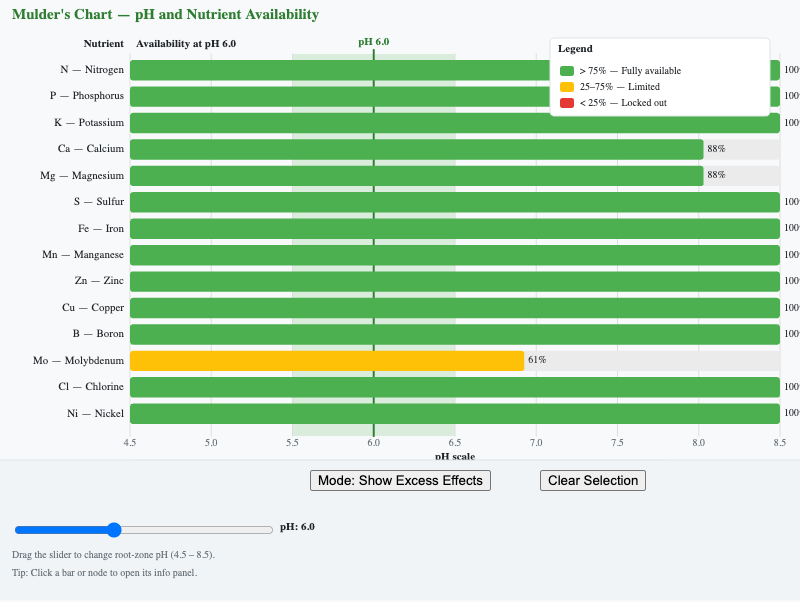
Drag a pH slider to see how each of 14 mineral nutrients changes in availability and visualize Mulder antagonism relationships between nutrients.
-
Ion Uptake Mechanisms Comparison
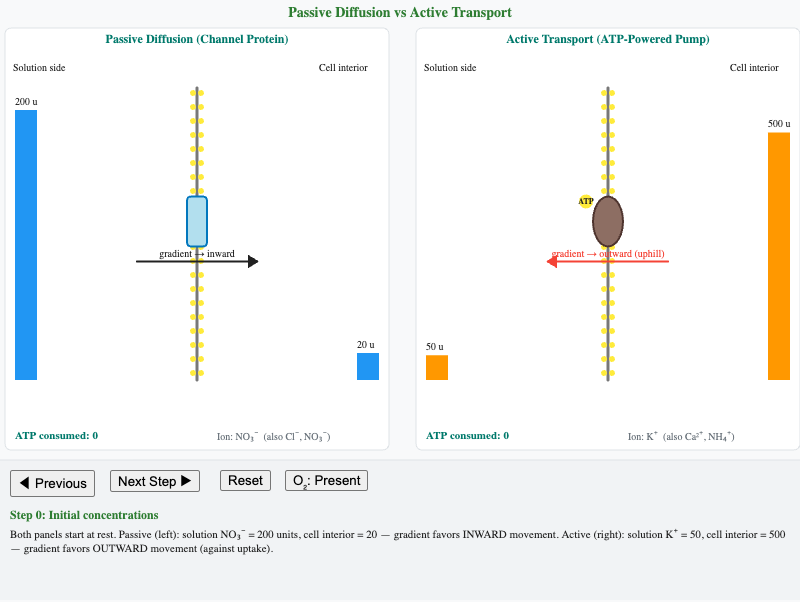
Step-through side-by-side comparison of passive diffusion and active transport with concrete concentration values and ATP consumption at each stage.
-
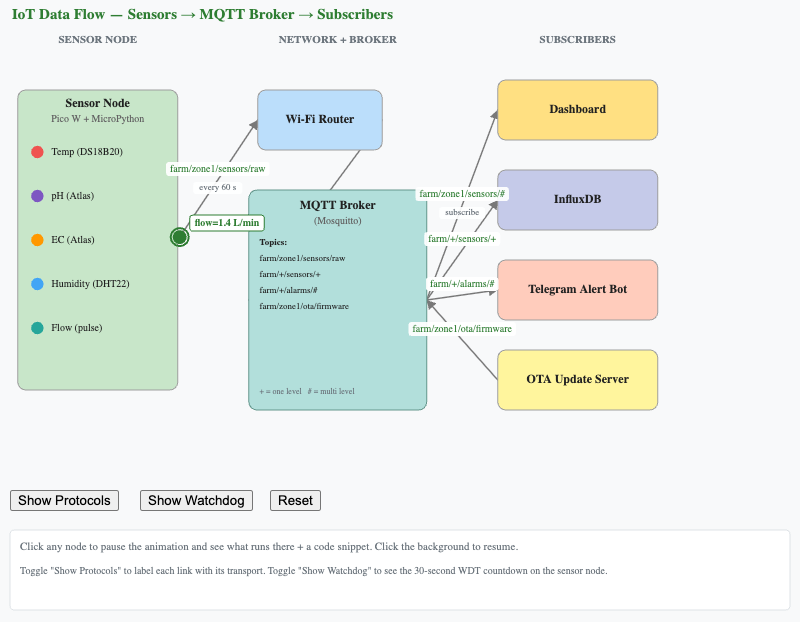
Architecture diagram tracing sensor data from a Pico W through Wi-Fi to an MQTT broker and out to dashboards, databases, alert bots, and OTA update server.
-
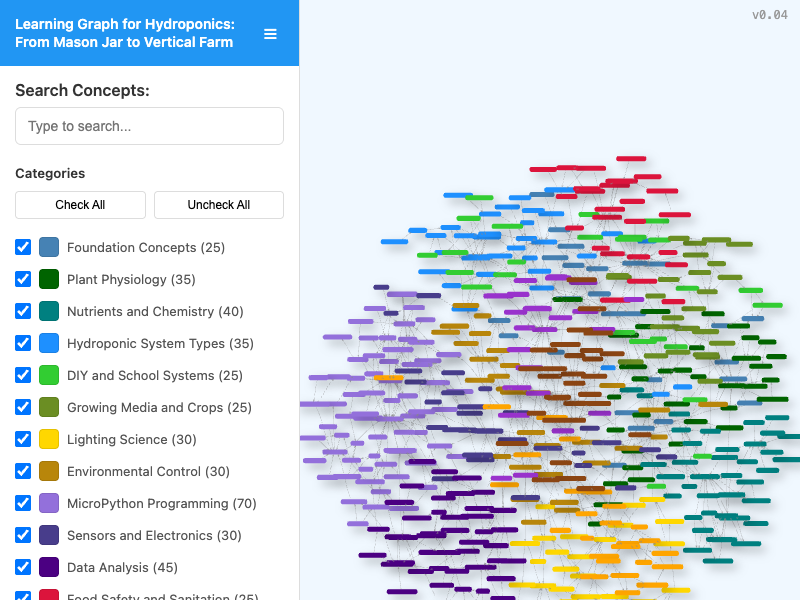
Interactive network graph of all course concepts with search, category filtering, and click-to-expand navigation showing concept dependencies.
-
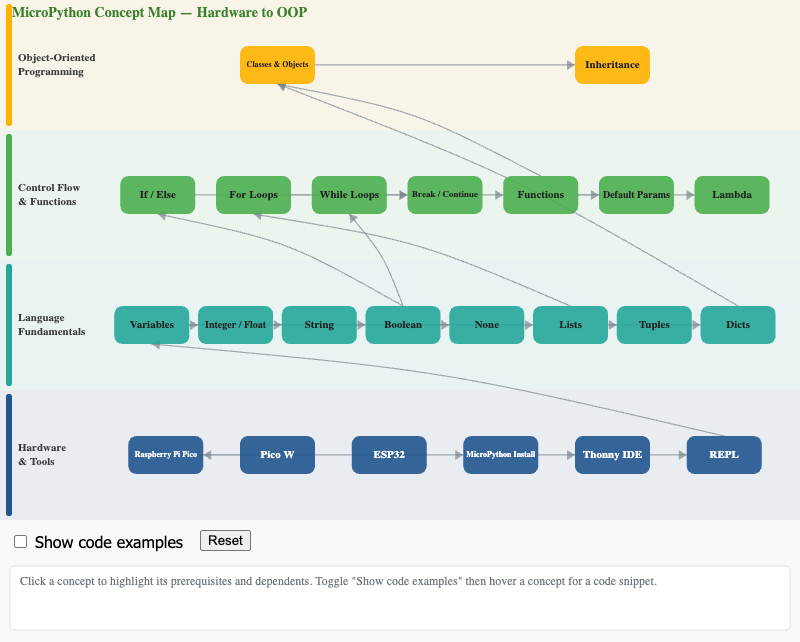
Four-tier dependency map showing how 25 MicroPython concepts build from hardware setup through language fundamentals to object-oriented programming.
-
Nutrient Deficiency Visual Diagnostic Tool
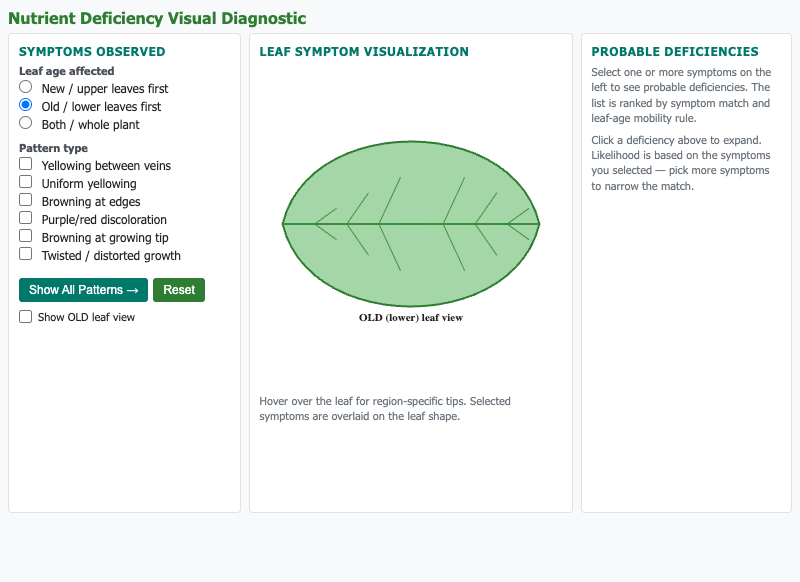
Select leaf symptoms (yellowing, browning, distortion) to identify nutrient deficiencies with a leaf illustration that updates based on mobility rules.
-
Nutrient Solution Mixing Calculator
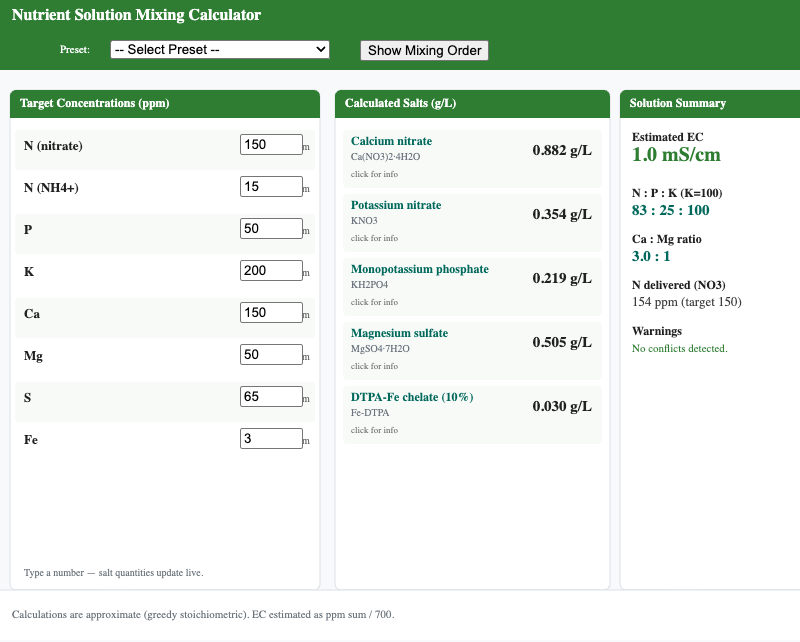
Enter target element concentrations in ppm to calculate the salt quantities needed with EC estimation, N:P:K ratio, and co-precipitation warnings.
-
Photosynthesis and Respiration Cycle
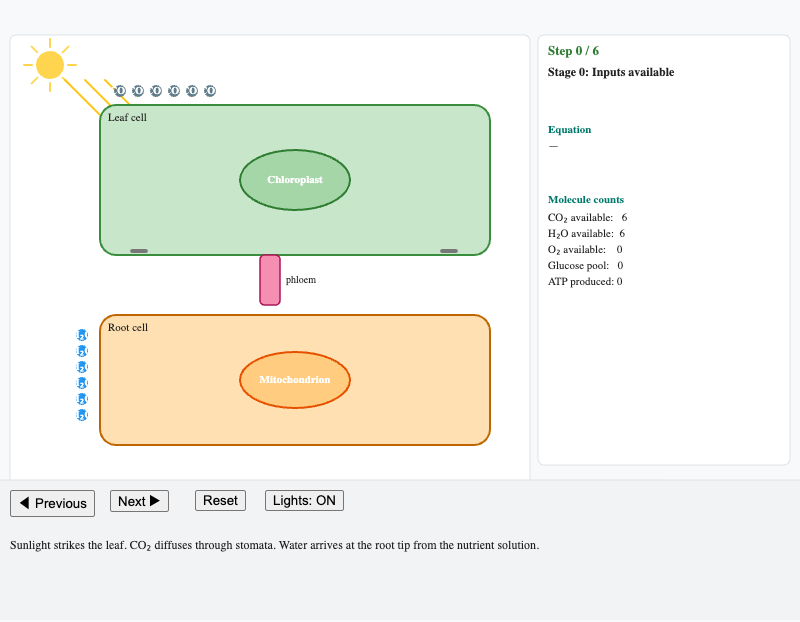
Step-through visualization of photosynthesis and cellular respiration showing inputs, outputs, molecule counts, and energy flow between chloroplast and mitochondrion.
-
Plant Life Cycle Stages Explorer
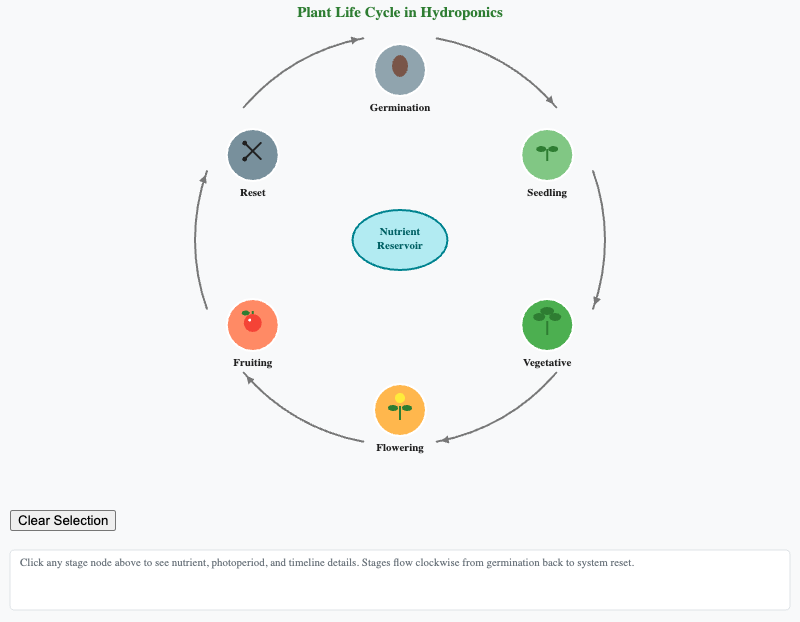
Circular diagram of six plant life stages with clickable nodes revealing nutrient, light, temperature, and timing requirements for each stage.
-
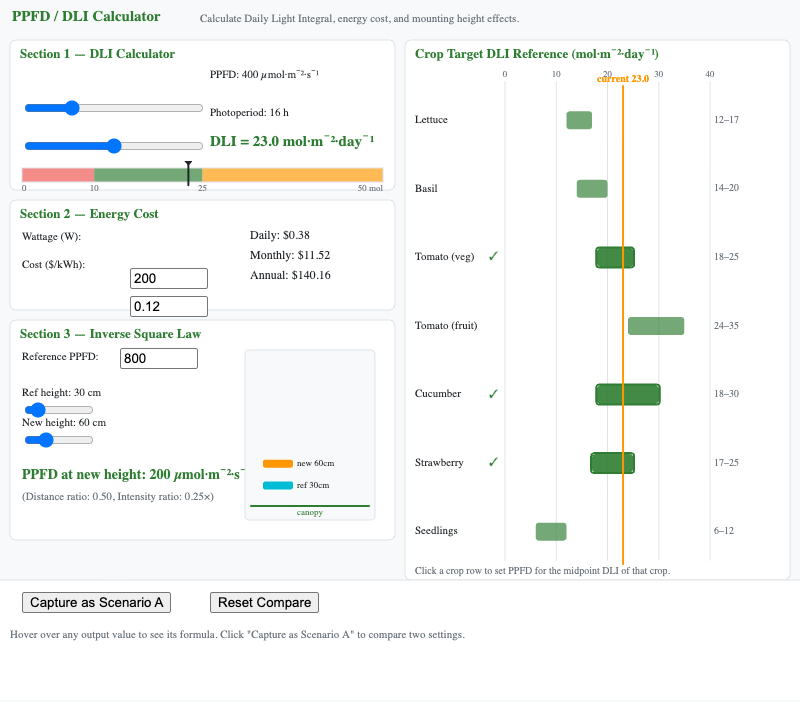
Calculate DLI from PPFD and photoperiod, compare lighting energy costs at your electricity rate, and see how fixture mounting height affects PPFD.
-
Root Cross-Section and Absorption Zones
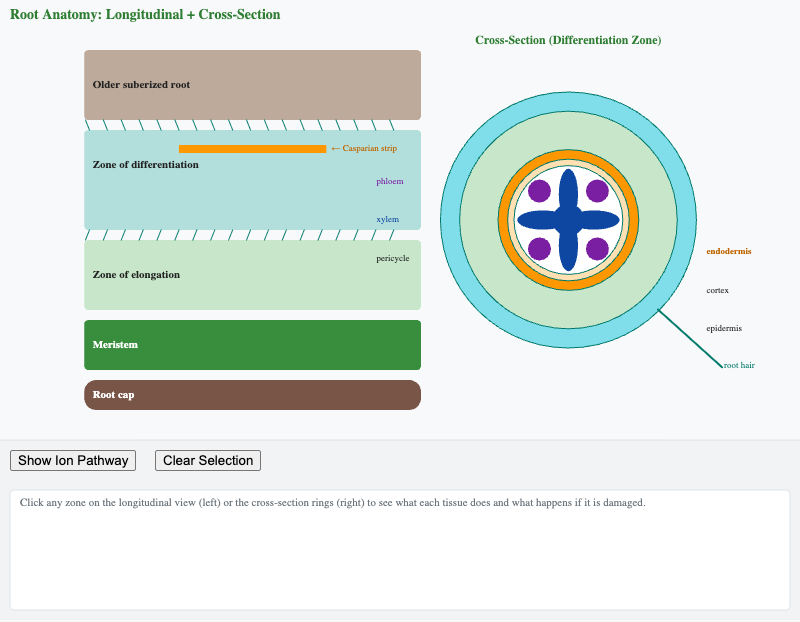
Clickable longitudinal root cross-section showing five zones from root cap to mature tissue with a lateral cross-section revealing vascular structure.
-
Root Exudate pH Drift Simulator
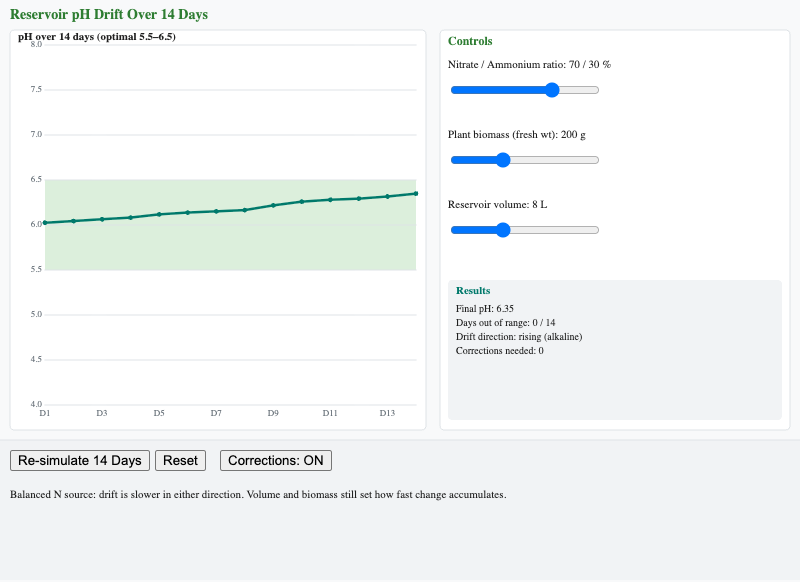
Simulate reservoir pH drift over 14 days by adjusting the nitrate-to-ammonium ratio to see how nitrogen source affects pH direction and rate of change.
-
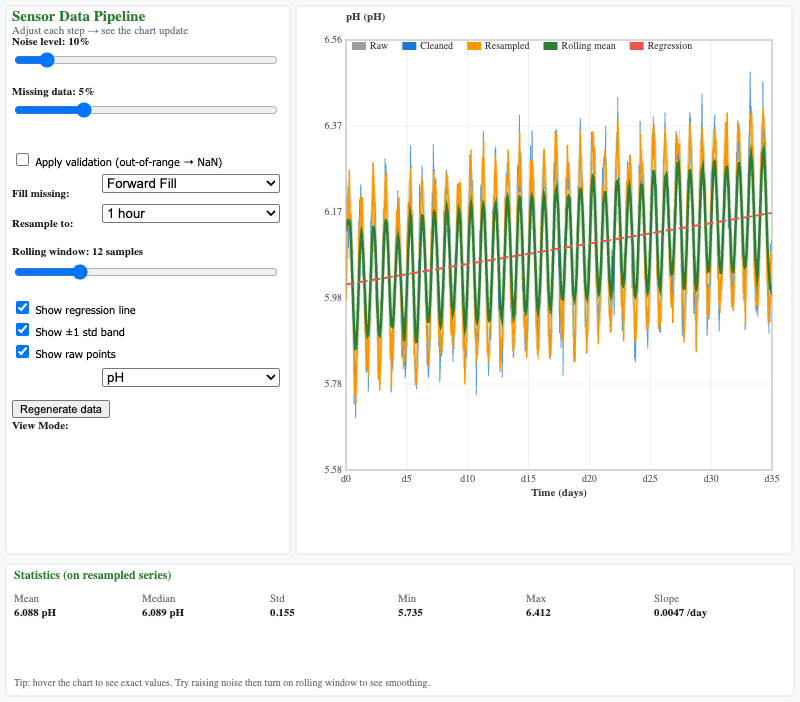
Apply data analysis steps (noise, validation, fill, resample, rolling average) to a simulated 35-day crop cycle dataset and observe real-time transformations.
-
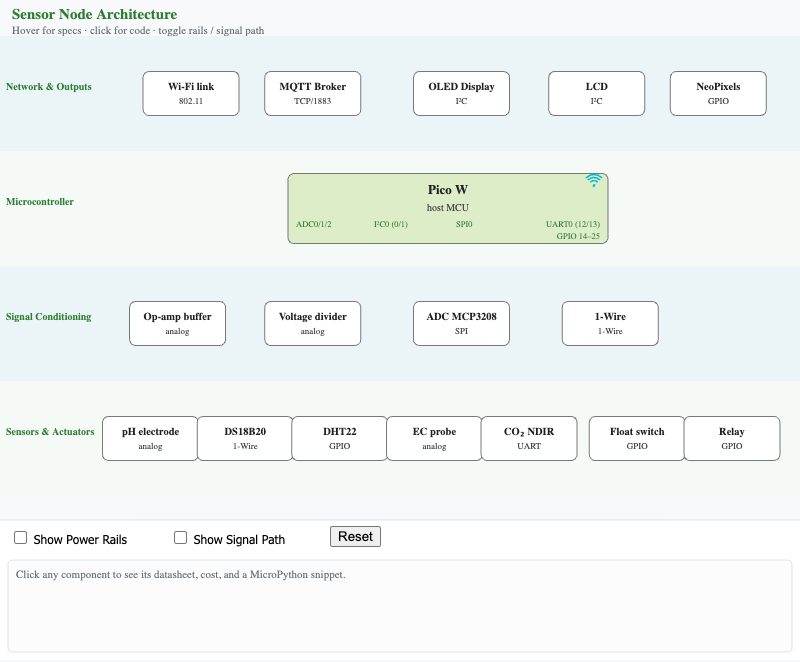
Four-layer hardware diagram showing sensors, signal conditioning, Pico W microcontroller, and network output with power supply rails (3.3V, 5V, 12V, GND).
-
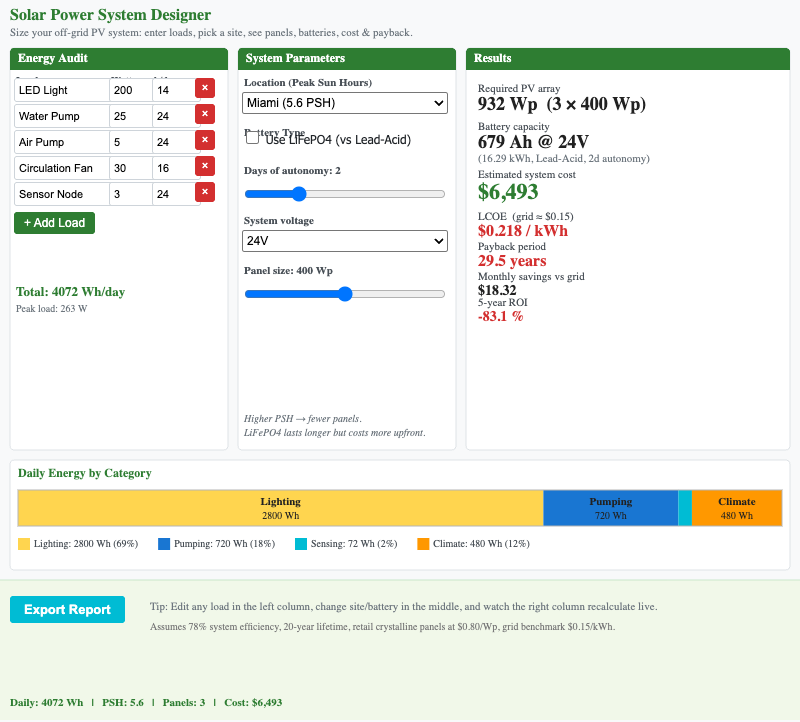
Design a solar power system by entering energy loads and location to calculate panel count, battery size, total cost, and levelized cost of energy (LCOE).
-
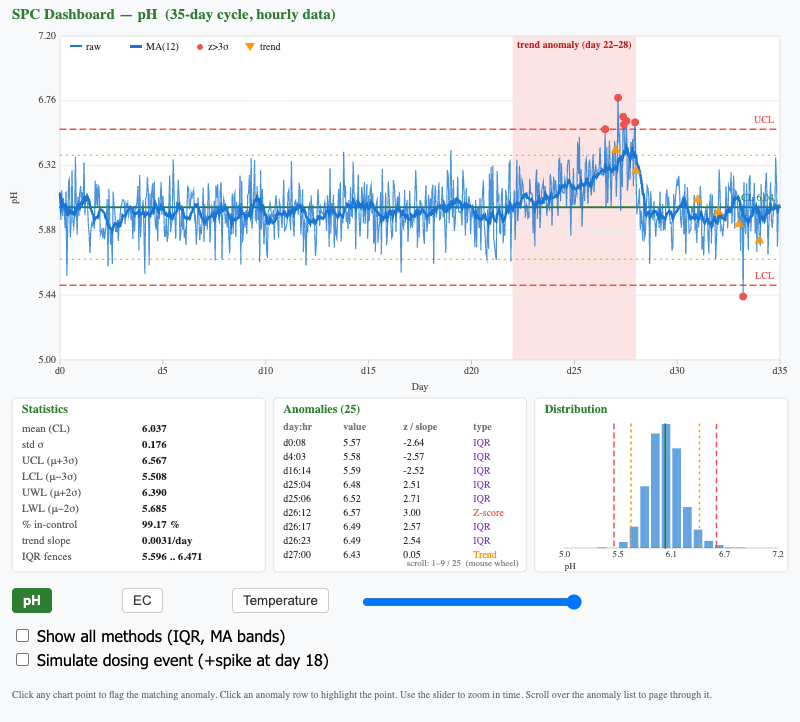
Statistical Process Control dashboard for a 35-day crop cycle with control charts, anomaly flags, and trend analysis for pH, EC, and temperature.
-
System Selection Decision Tree
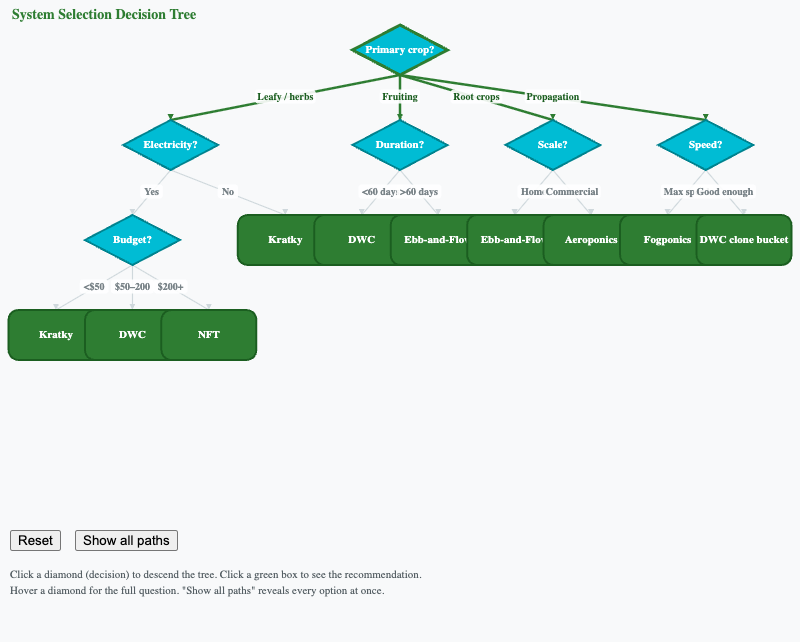
Clickable decision flowchart guiding students through crop type, budget, and electricity availability to recommend the most suitable hydroponic system.
-
VPD and Environmental Parameter Dashboard
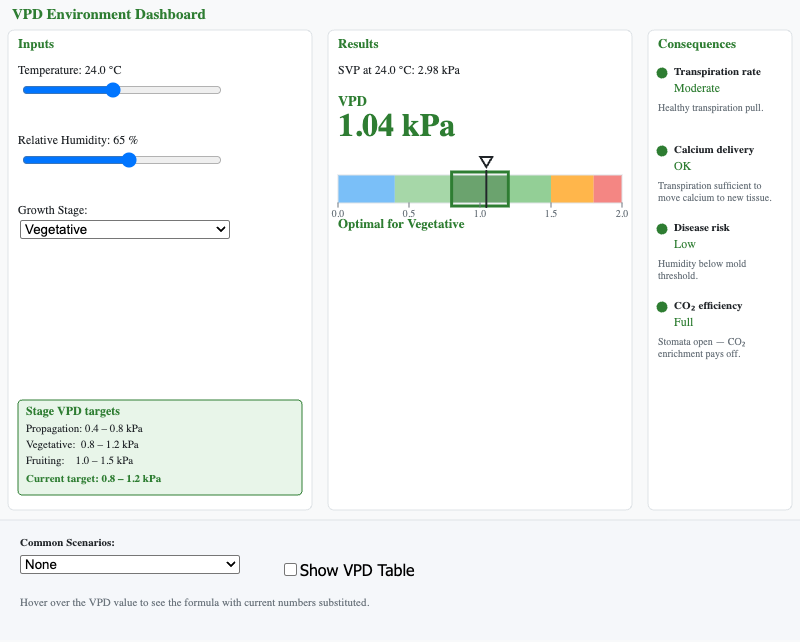
Set temperature and humidity sliders to calculate Vapor Pressure Deficit in real time with color-coded feedback for propagation, vegetative, and fruiting stages.