Textbook Dashboard
Case study of using Claude Desiger to generate a dashboard used for optimizing the token usage for textbook generation for teachers with the Claude Pro ($20/month) plan.
Initial Prompt Given to Anthropic Claude Designer Tool
Prompt
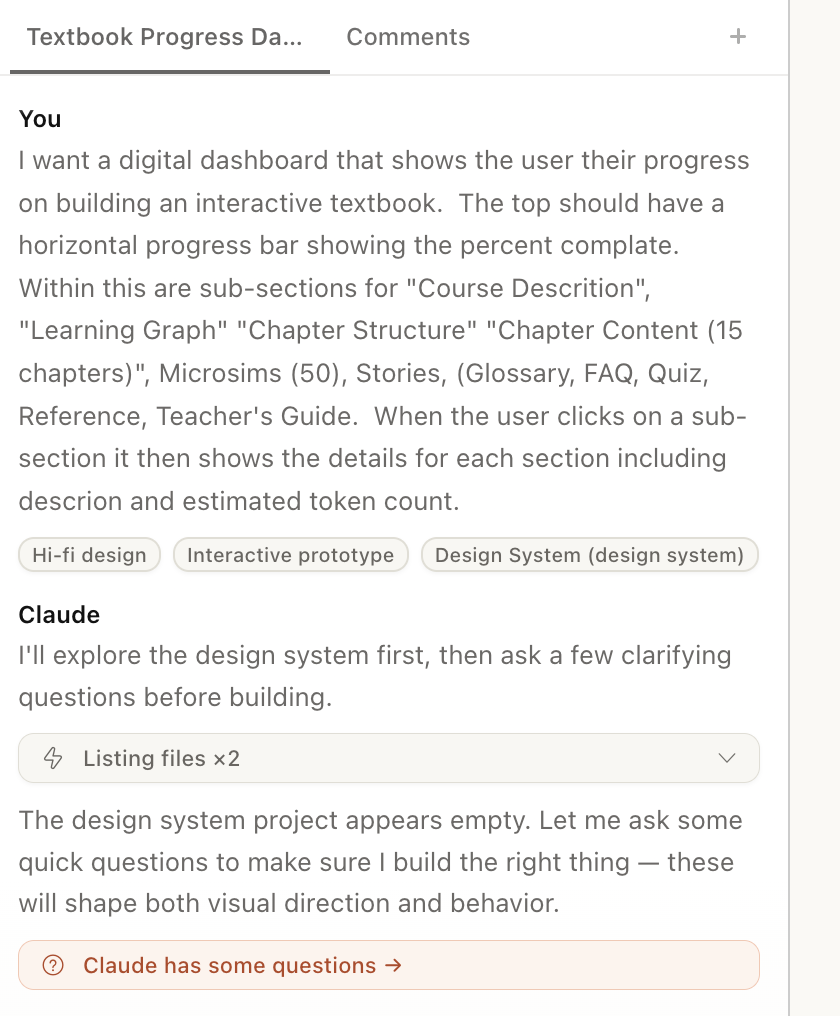
I want a digital dashboard that shows the user their progress on building an interactive textbook. The top should have a horizontal progress bar showing the percent complate. Within this are sub-sections for "Course Description", "Learning Graph" "Chapter Structure" "Chapter Content (15 chapters)", Microsims (50), Stories, Glossary, FAQ, Quiz, Reference, Teacher's Guide. When the user clicks on a sub-section it then shows the details for each section including description and estimated token count.
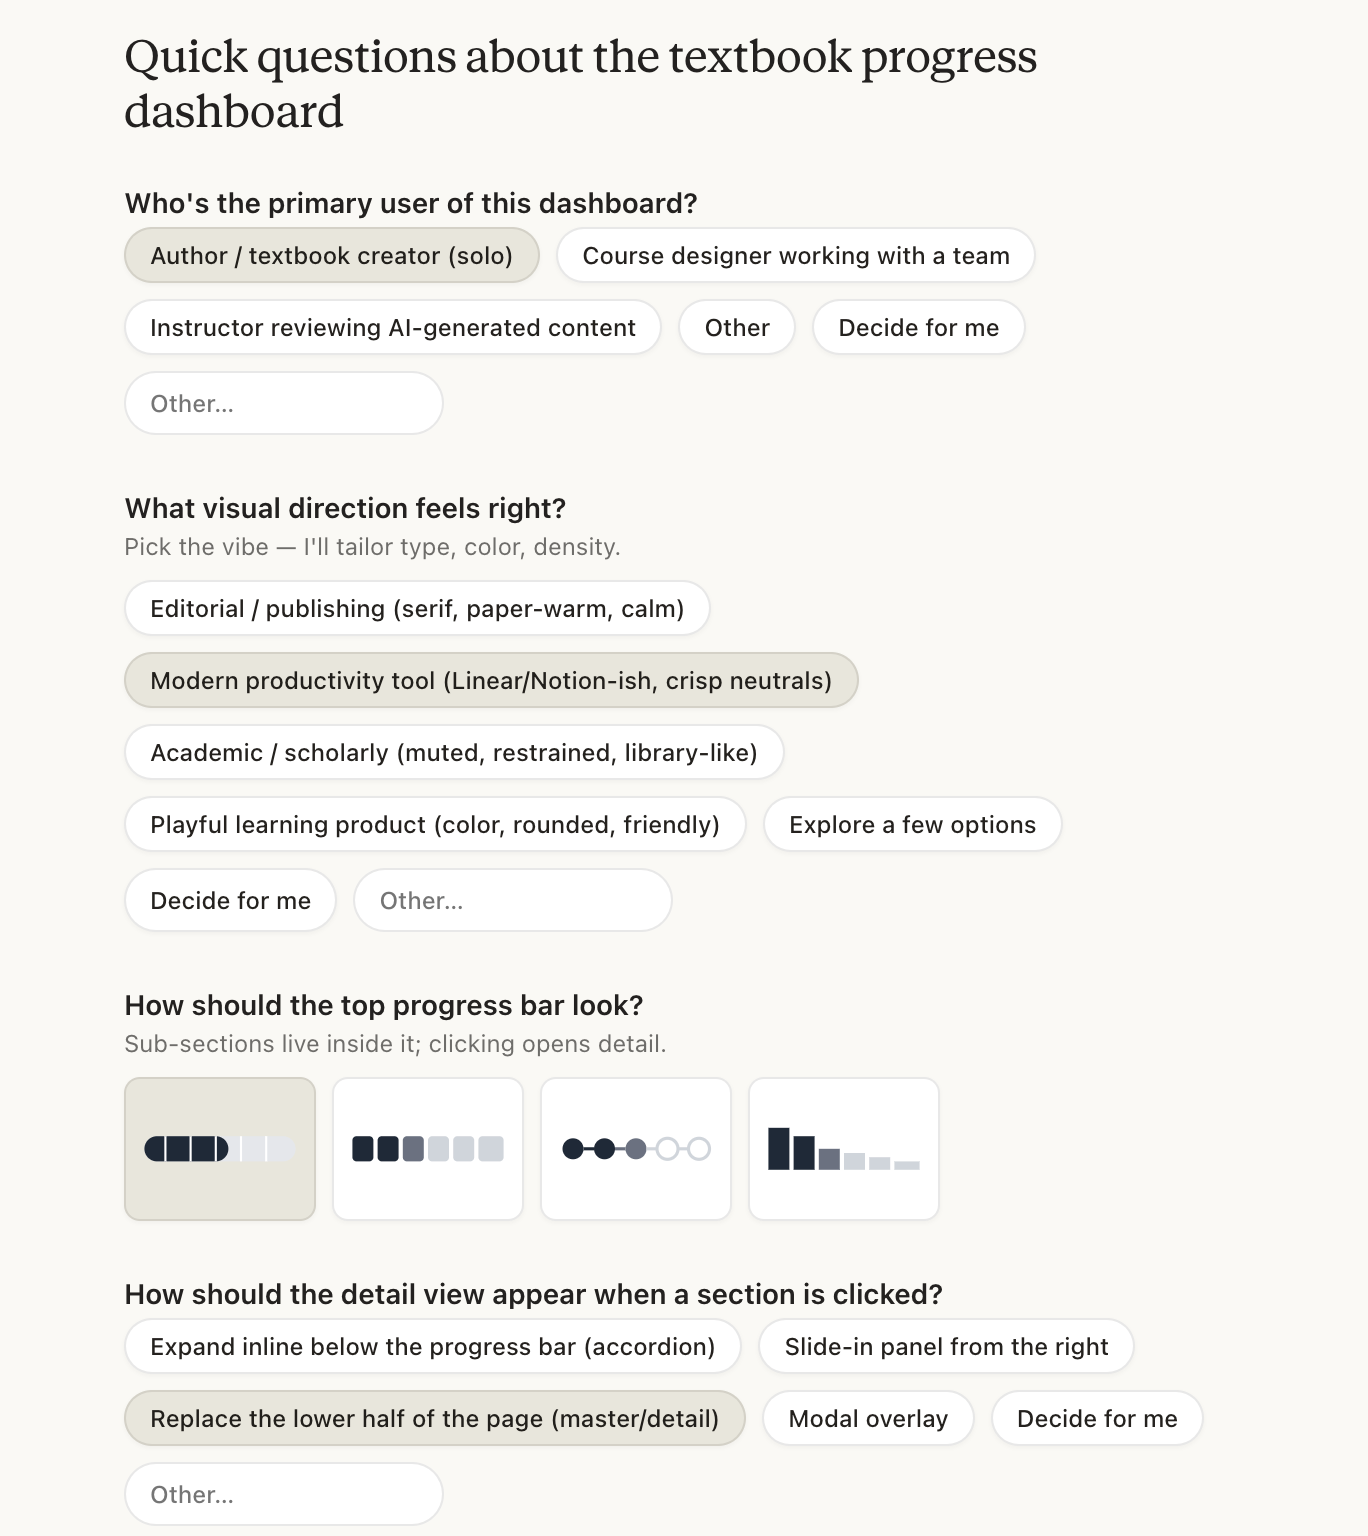
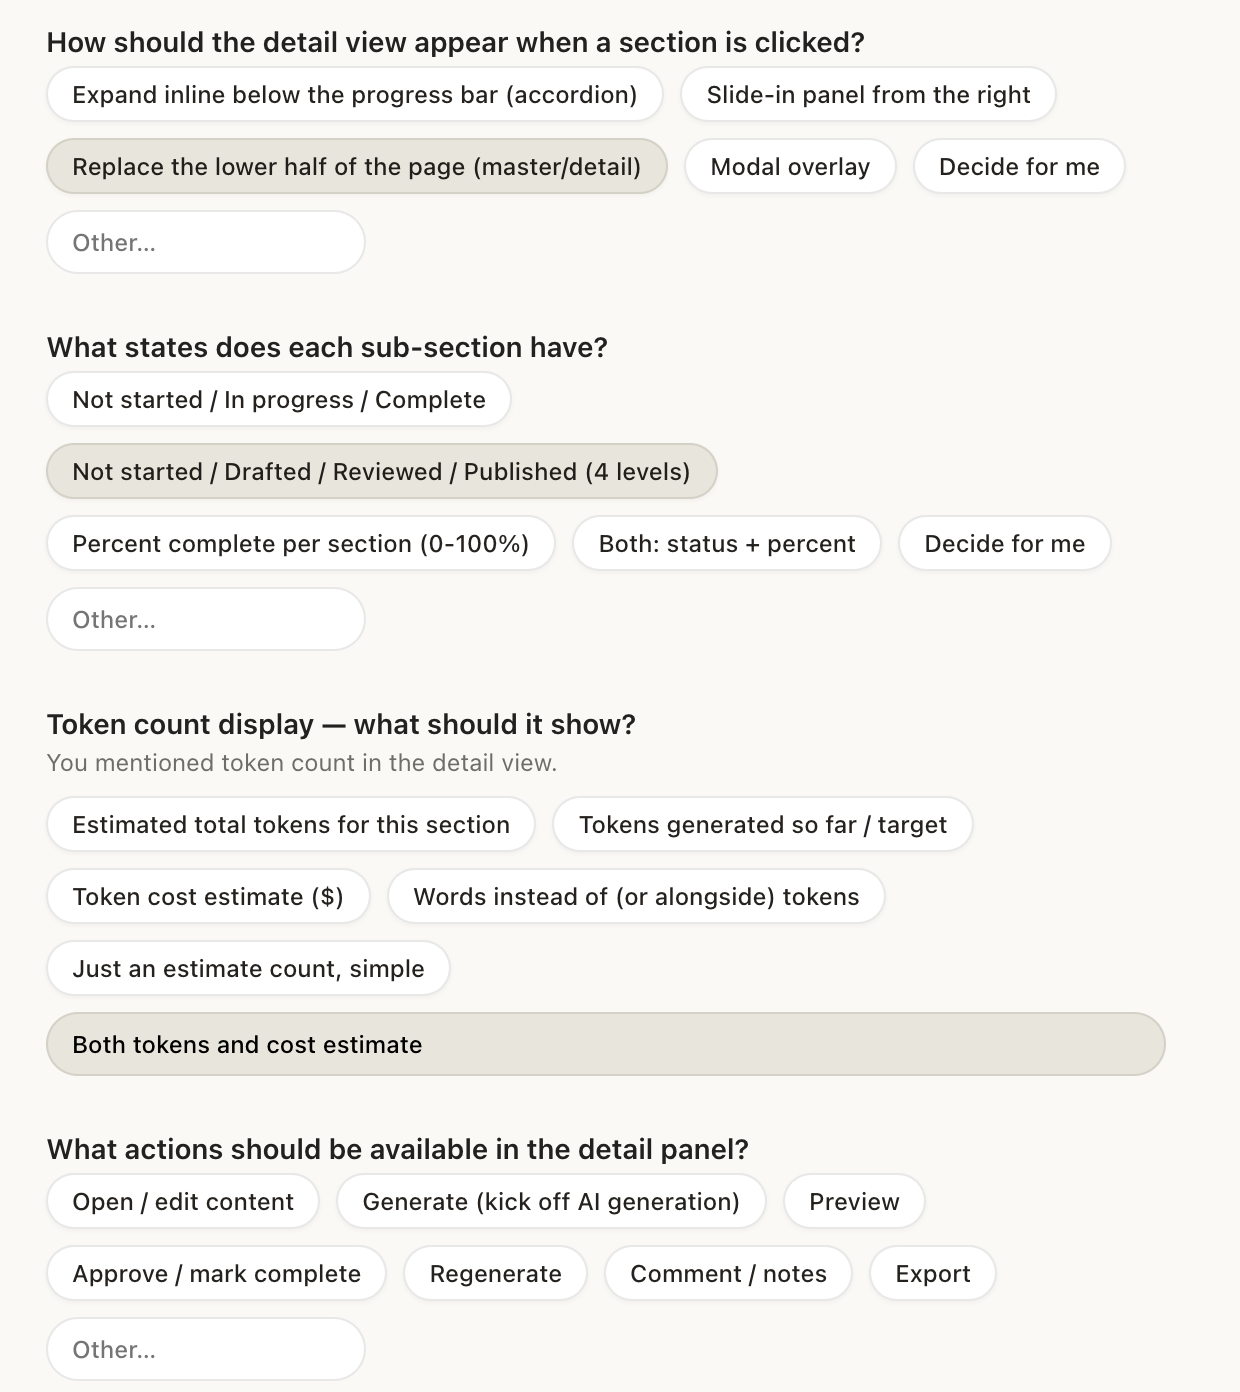
Claude Design Dialogs
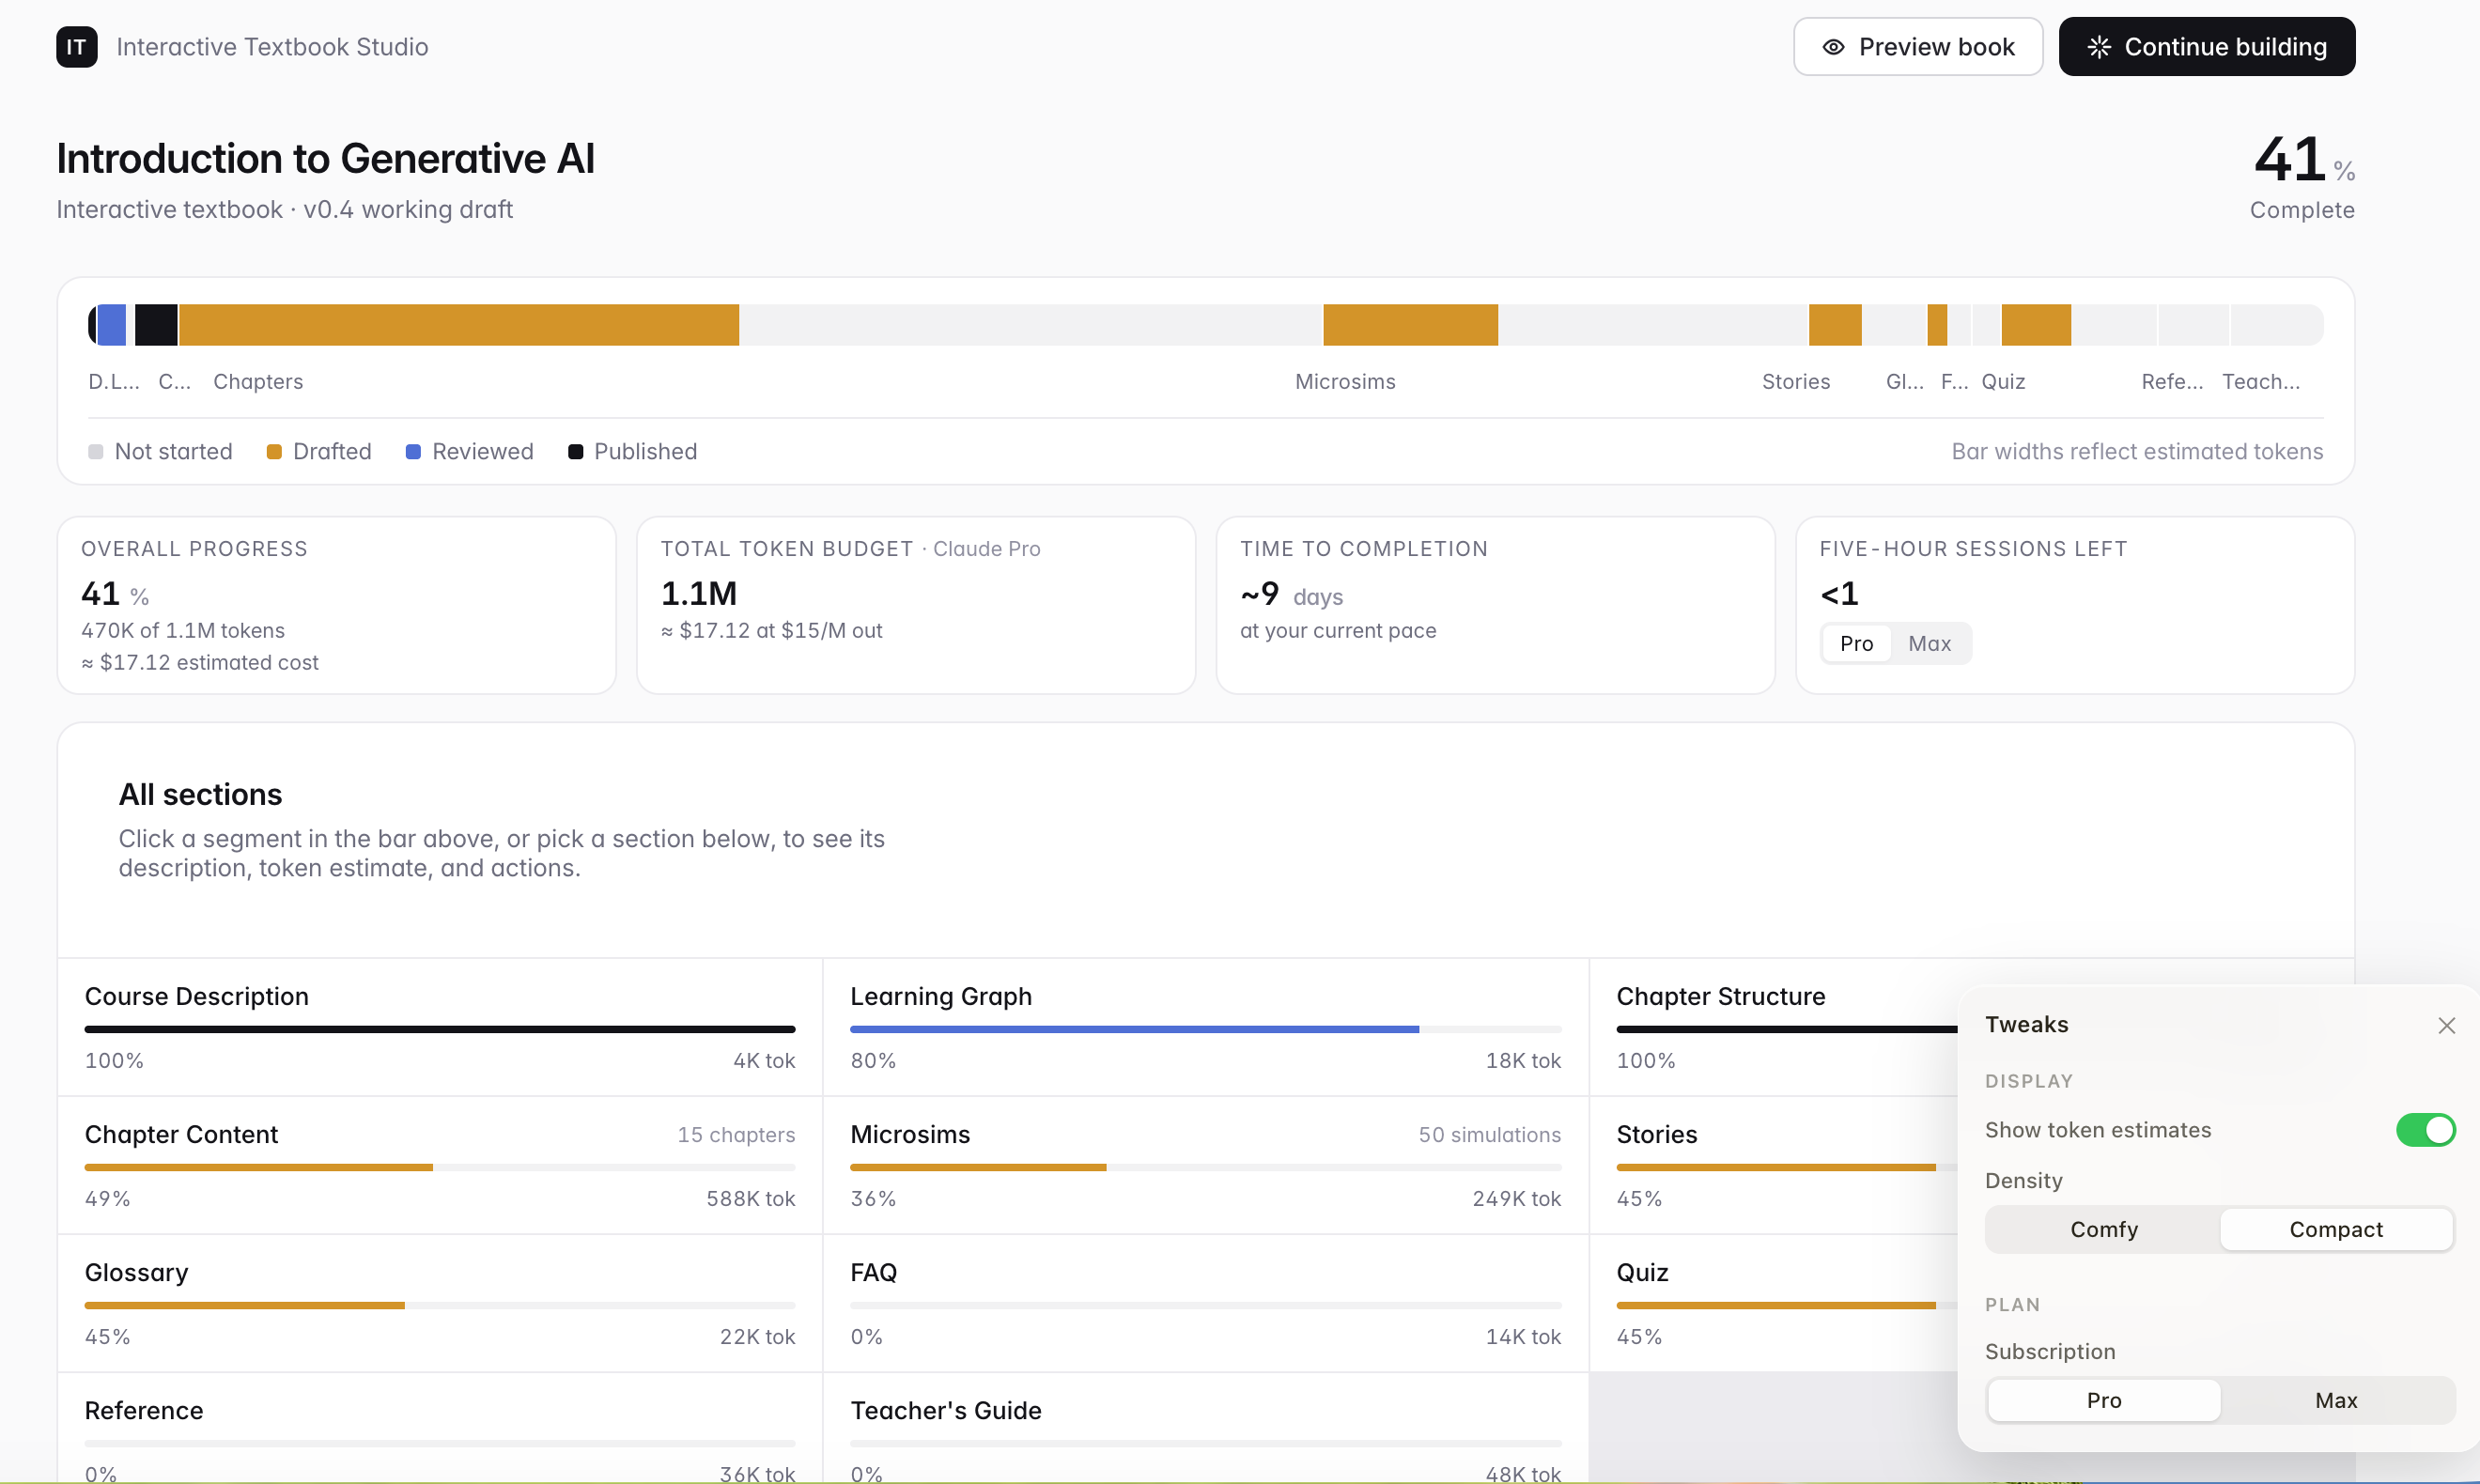
Full Dashboard Generate By Claude Design