List of MicroSims for Token Efficiency
This course has 44 interactive MicroSims to help students explore token-efficient LLM system design through hands-on simulations, dashboards, and pipeline diagrams.
-
A/B Test Outcome Decision Matrix
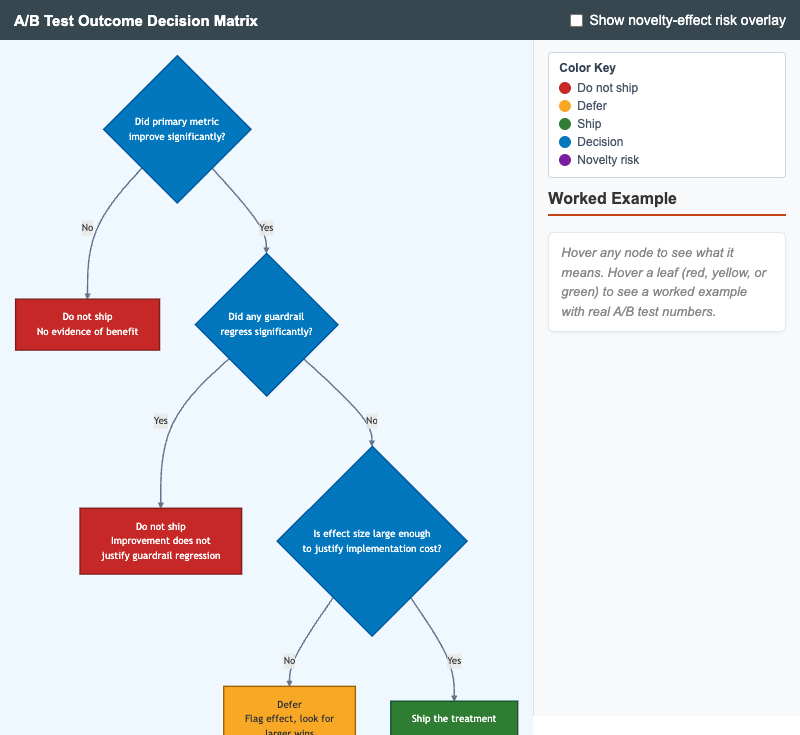
Interactive decision tree for judging whether to ship an LLM A/B test treatment based on primary-metric improvement, guardrail-metric regression, and effect size.
-
Agent Budget Policy with Multiple Limits
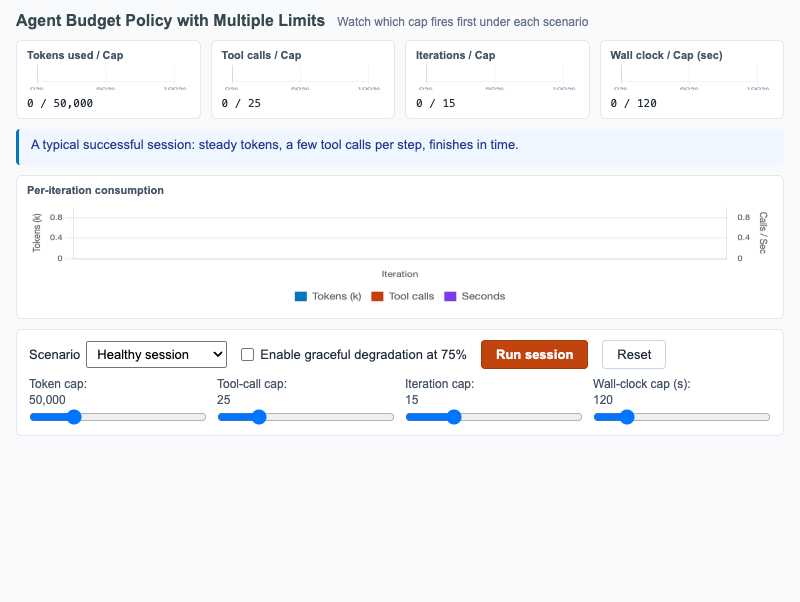
Multi-meter dashboard showing tokens, tool calls, iterations, and wall-clock budgets firing under healthy and pathological agent scenarios.
-
Anthropic Prompt Caching Lifecycle
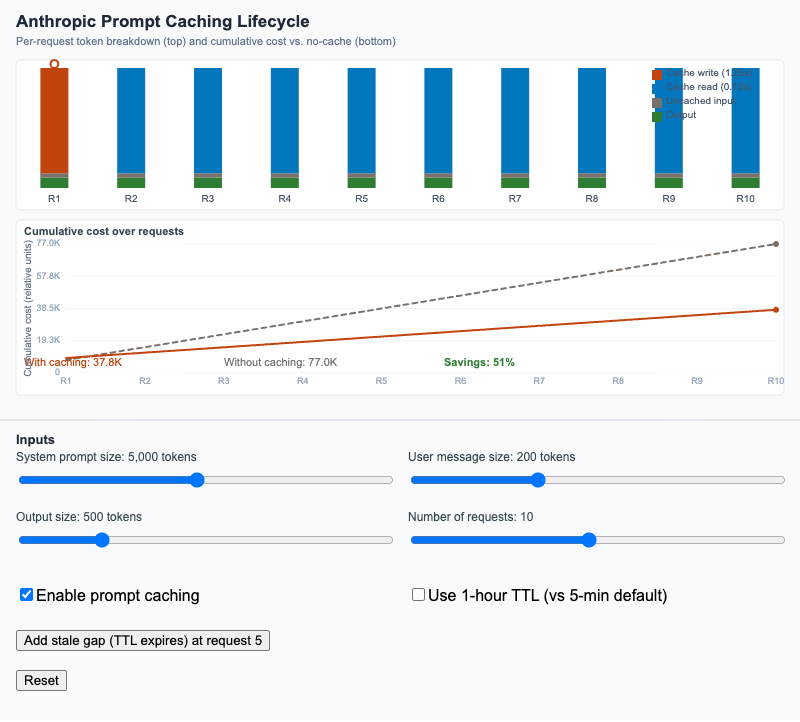
Visualize per-request token breakdown and cumulative cost across a sequence of requests with and without Anthropic's prompt caching feature.
-
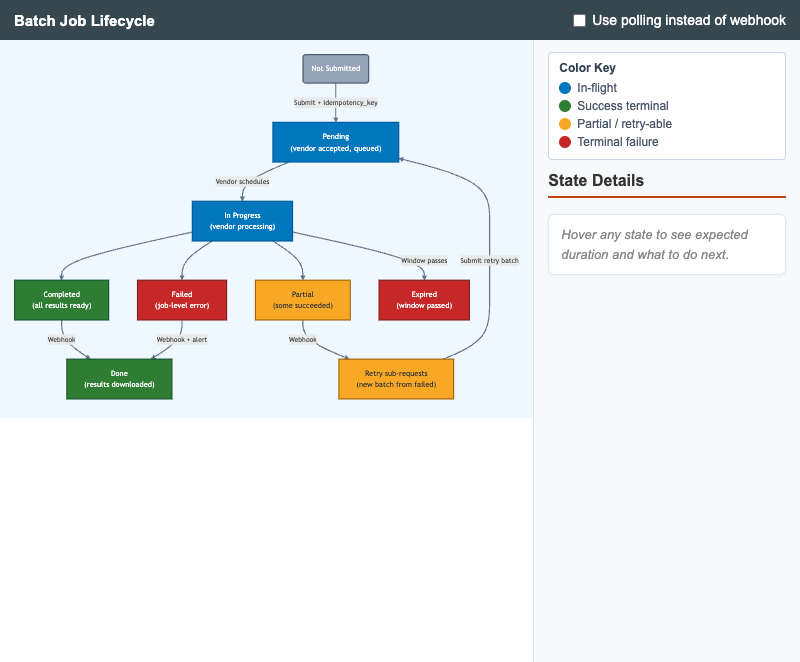
State diagram of an LLM batch job from submission through download, with idempotency, retry, and webhook vs polling notification paths.
-
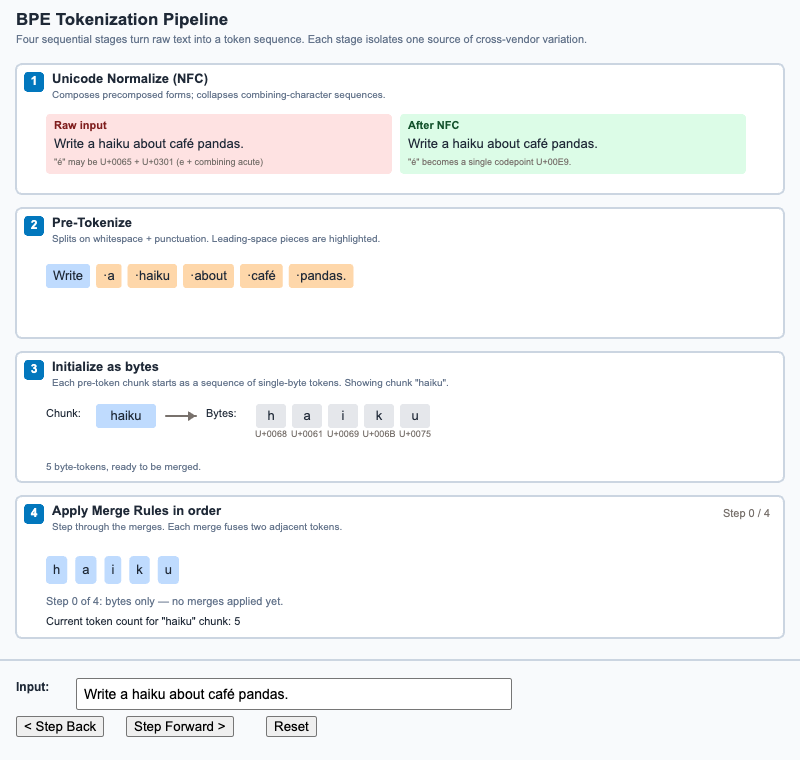
Step through the four stages a string passes through to become a token sequence - Unicode normalize, pre-tokenize, byte-init, and merge.
-
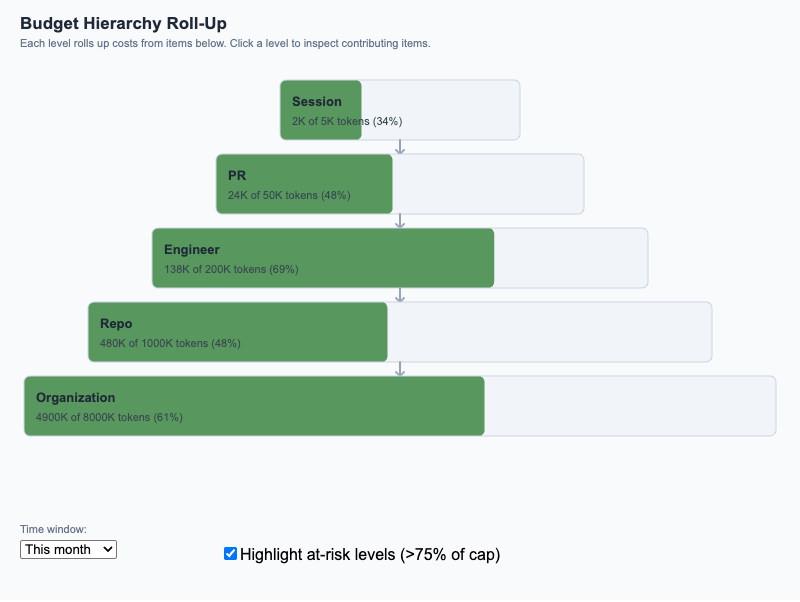
Pyramid diagram showing how individual session costs roll up through PR, engineer, repo, and organization budgets, with at-risk highlighting at 75%/90%.
-
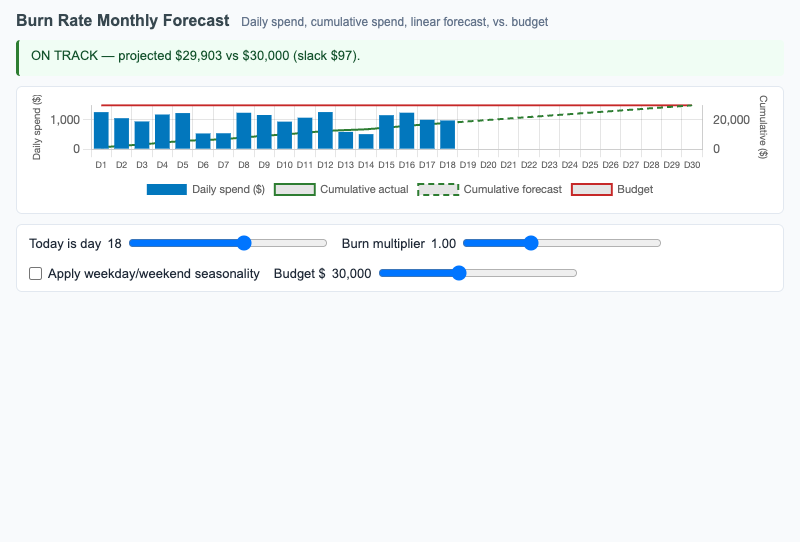
Daily and cumulative LLM spend with linear forecast extrapolation against a budget line, surfacing whether current spend is on track or over budget.
-
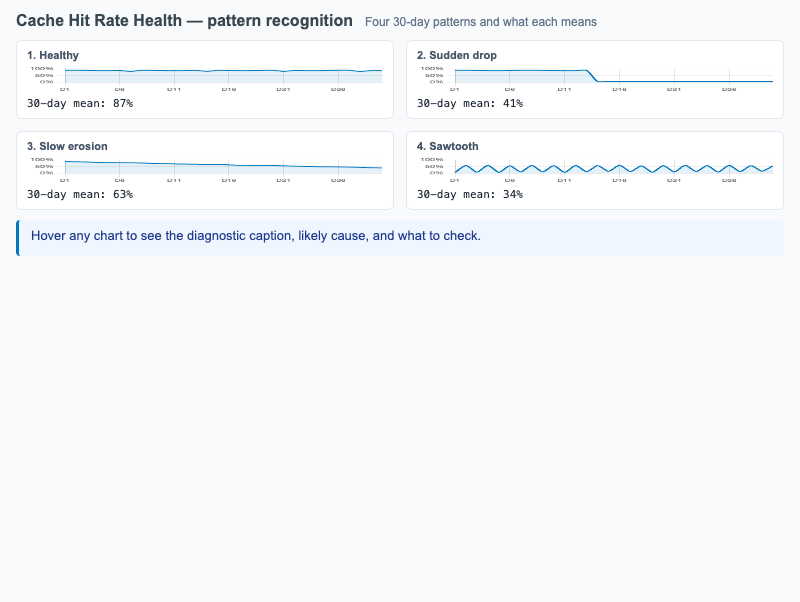
Four representative cache hit-rate patterns (healthy, sudden drop, slow erosion, sawtooth) with diagnostic captions and remediation hints.
-
Cheap-First Cascade with Escalation
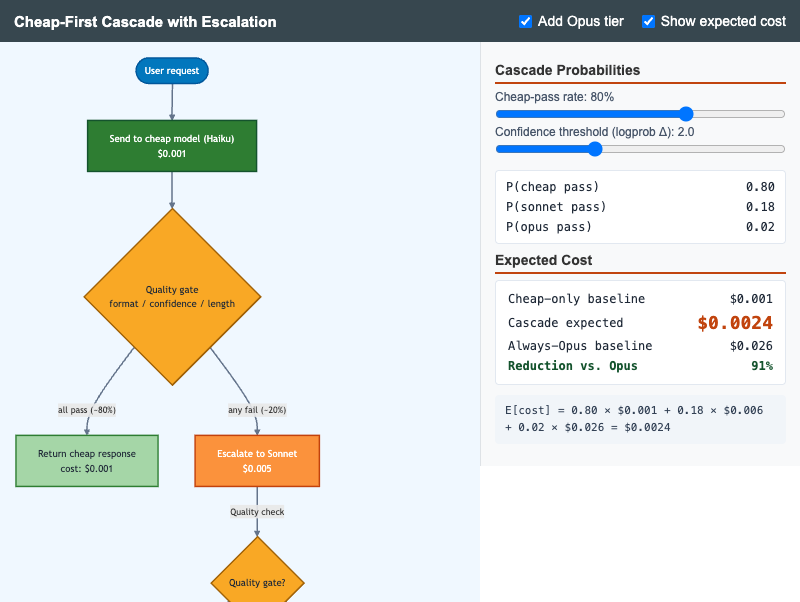
Flowchart MicroSim showing the cheap-first cascade with quality-gate escalation to Sonnet and Opus, with live expected-cost calculation.
-
Context Window Budget Allocation Over a Long Session
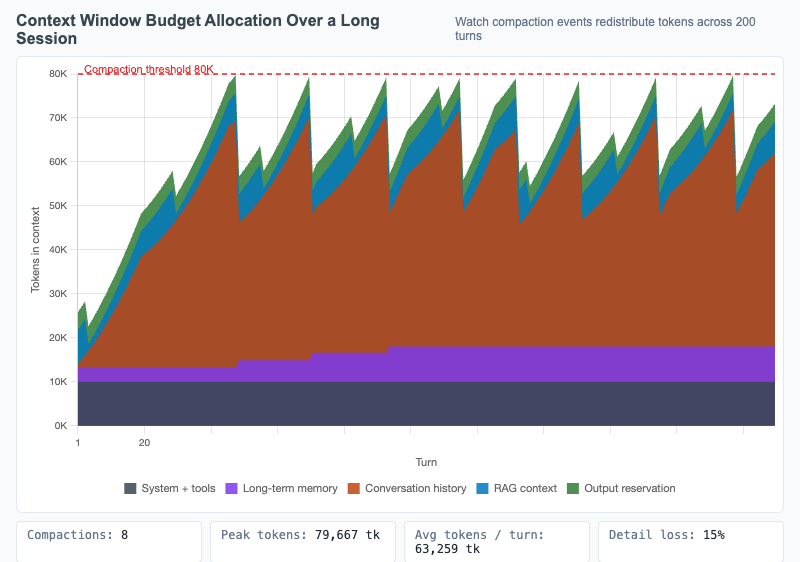
Stacked area chart showing how the context window is allocated across components over 200 turns, with compaction events visible as drops in conversation-history allocation.
-
Continuous Cost Operating Model
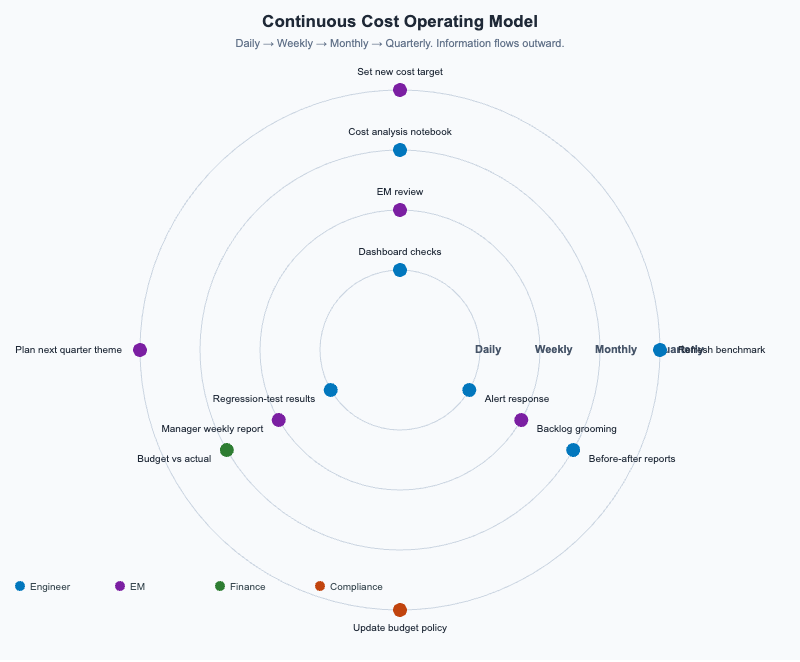
Concentric rings (Daily / Weekly / Monthly / Quarterly) showing the activities, roles, and artifacts that sustain a long-term LLM cost-optimization program.
-
Conversation Message Structure
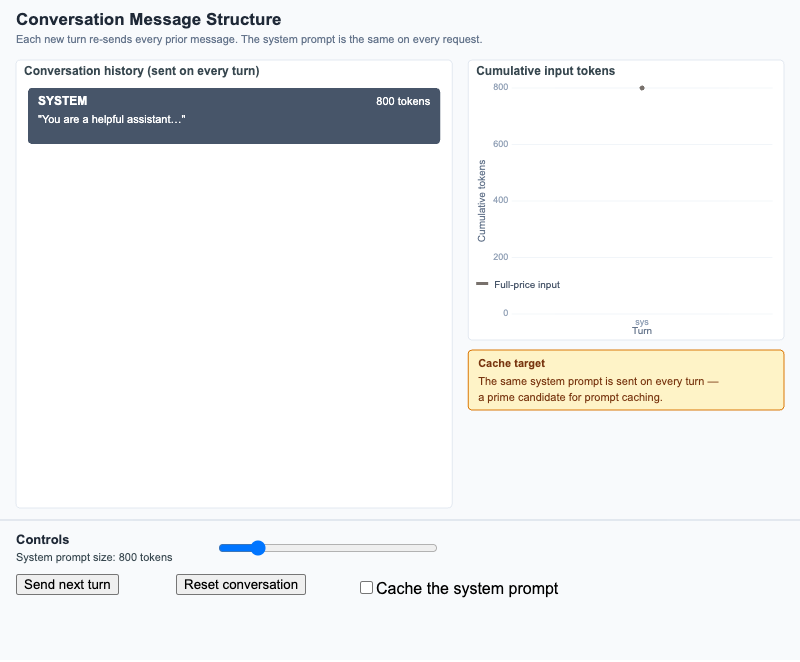
Watch a multi-turn dialogue accumulate input tokens turn by turn, and see why the system-prompt prefix is the prime caching target.
-
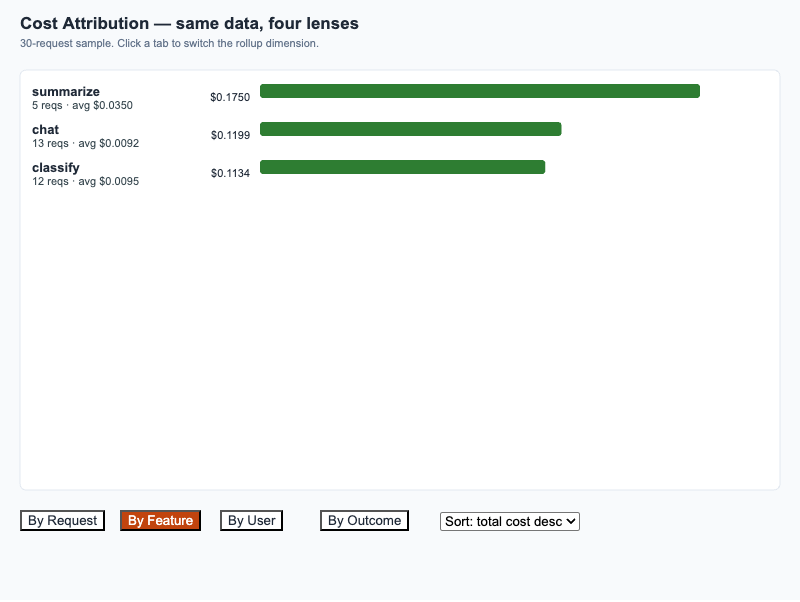
30-request sample rolled up by Request, Feature, User, and Outcome — same data, four lenses.
-
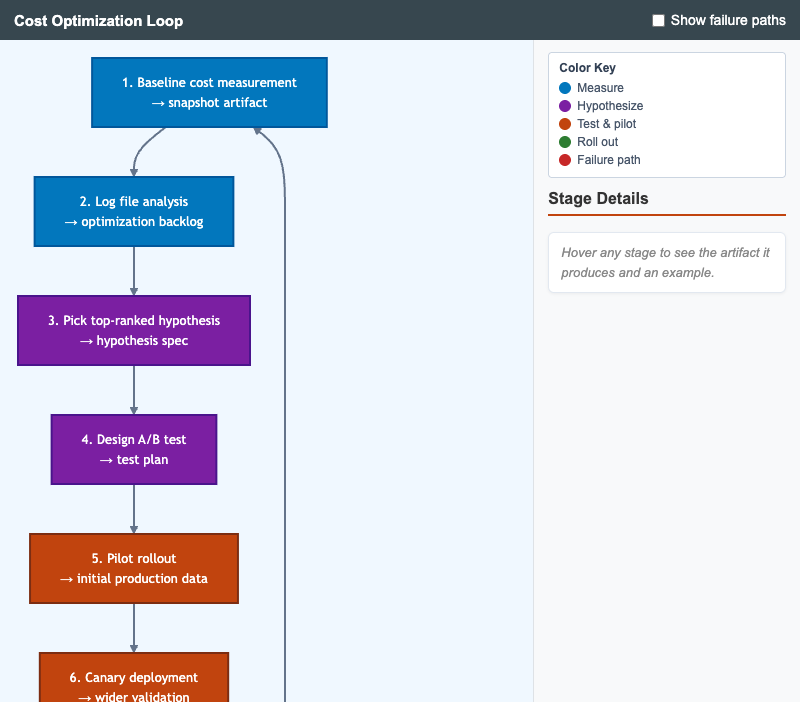
Circular workflow showing the full cost-optimization cycle from baseline measurement through report and back to the next baseline, with optional failure-path overlay.
-
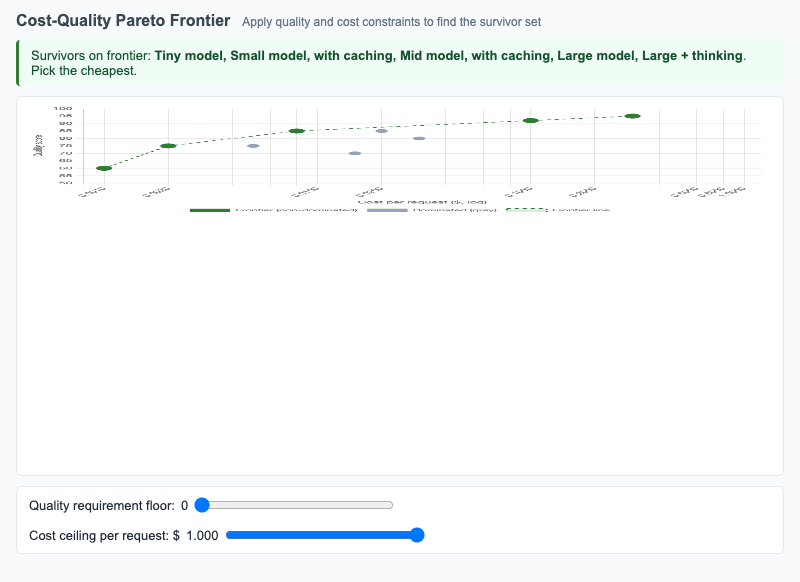
Scatter plot of model configurations on cost vs quality with the Pareto frontier highlighted; sliders apply quality and cost constraints to find the survivor set.
-
Cross-Vendor Caching Comparison
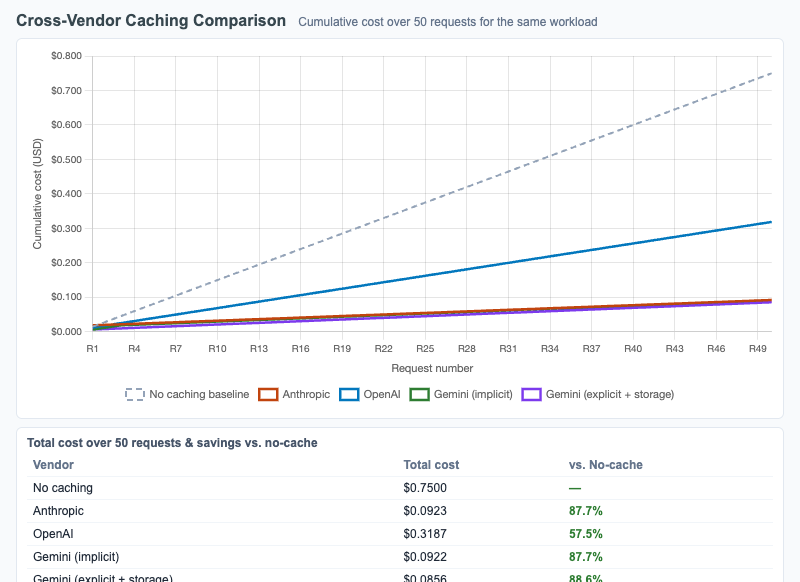
Multi-line cumulative cost chart comparing Anthropic, OpenAI, and Gemini caching mechanics across 50 requests, with sliders for prefix size, cache lifetime, and request frequency.
-
Cross-Vendor Token Count Drift
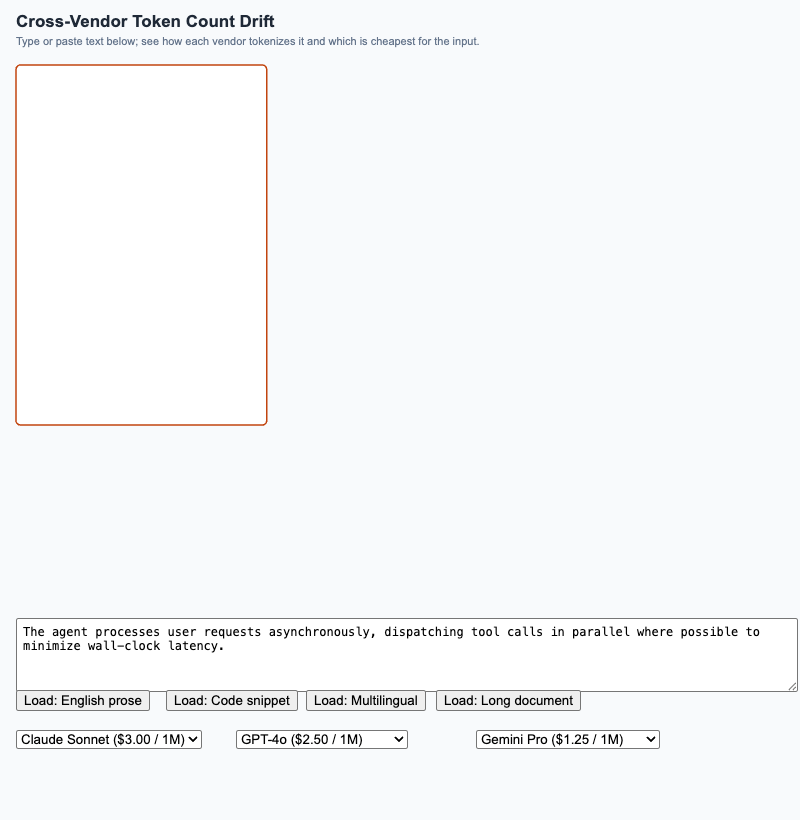
Side-by-side comparison of how Anthropic, OpenAI, and Gemini tokenize the same input, with a live per-vendor cost calculation that highlights the cheapest option.
-
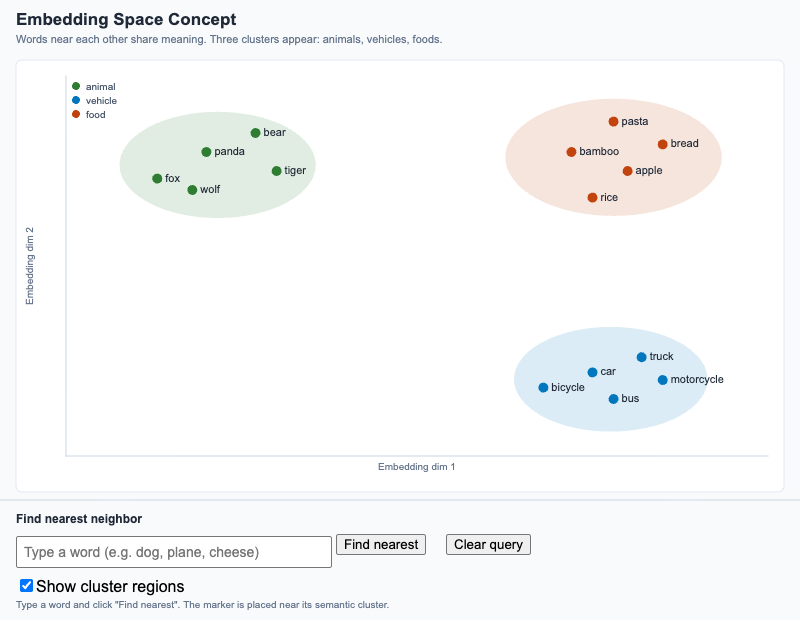
Visualize how semantically related words cluster in 2D, and use a "find nearest" tool to see why nearness in embedding space means semantic similarity.
-
Function Calling Loop with Tool Choice
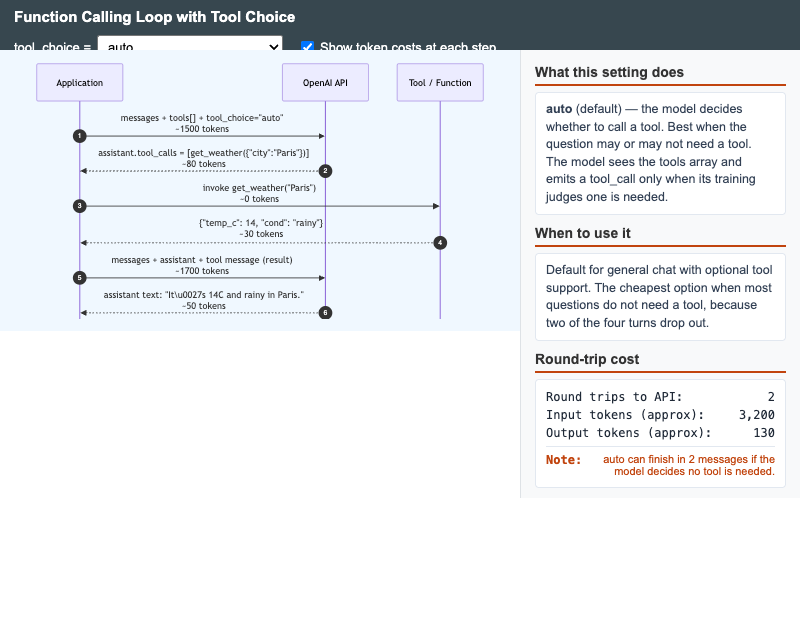
Interactive sequence diagram showing the OpenAI function-calling round-trip and how each tool_choice setting (auto, none, required, specific) changes the loop shape and token cost.
-
Interactive Tokenizer Explorer
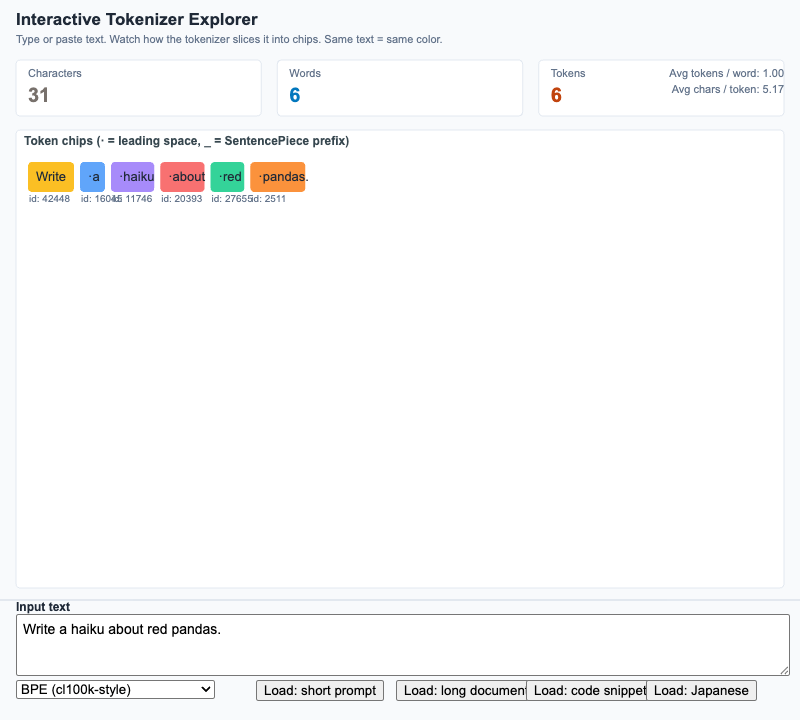
Type any string and watch a tokenizer break it into chips, with live character / word / token counts and a tokenizer-family toggle.
-
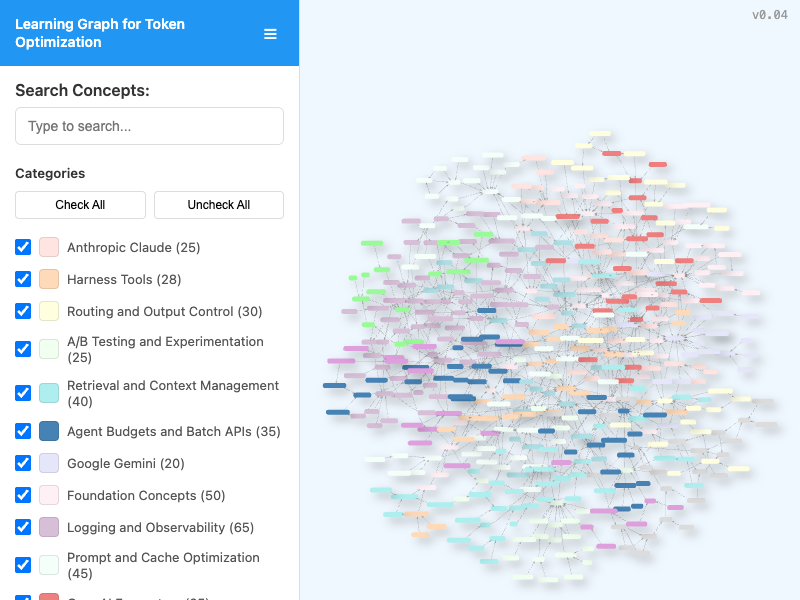
Interactive viewer for exploring the course learning graph with search, category filtering, pan/zoom navigation, and live node/edge statistics.
-
LLM Logging Pipeline with Privacy Filters
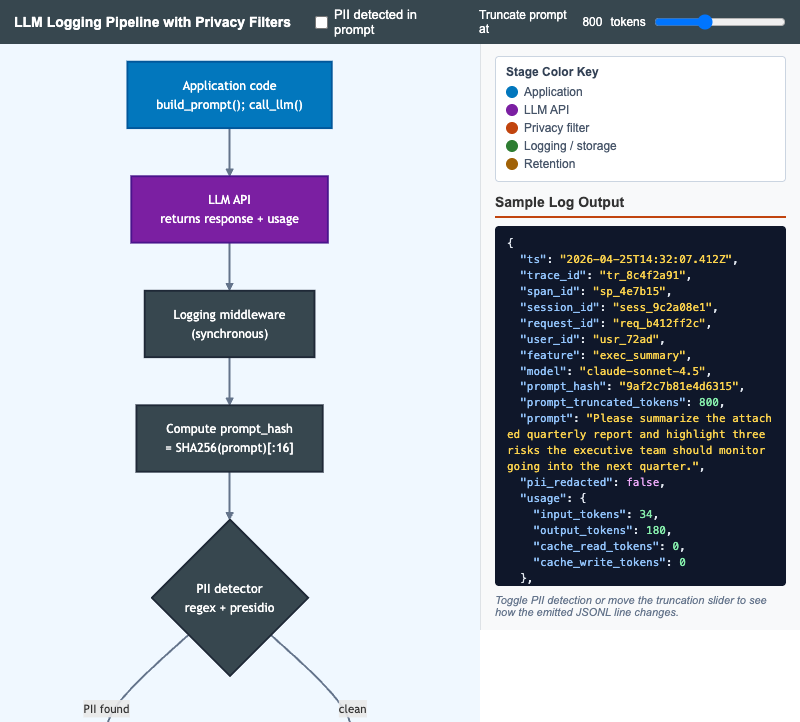
Interactive Mermaid flowchart that walks an LLM call from application code through PII detection, redaction, cost computation, retention, and storage with a live JSONL log preview.
-
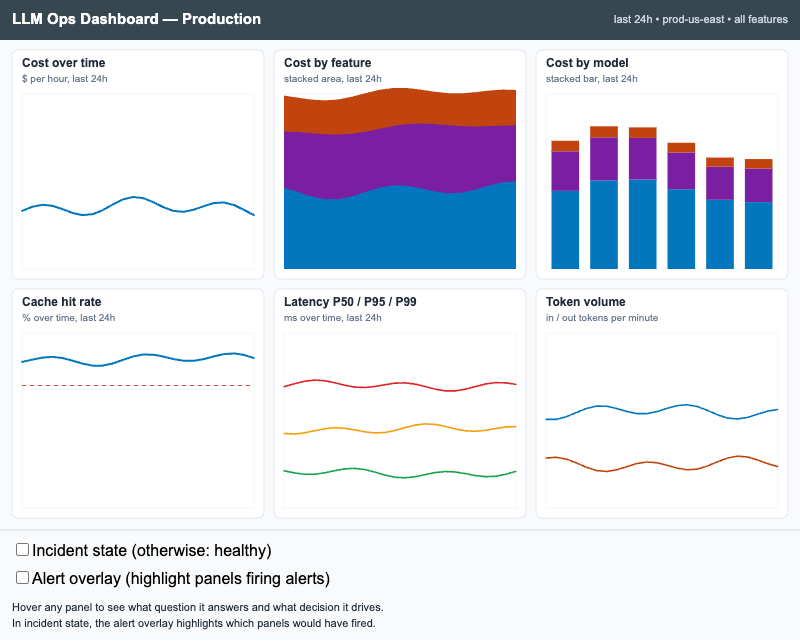
Interactive p5.js wireframe of a six-panel LLM observability dashboard with healthy and incident states, hoverable panel rationales, and an alert overlay that highlights firing panels.
-
Long-Term and Short-Term Memory Architecture
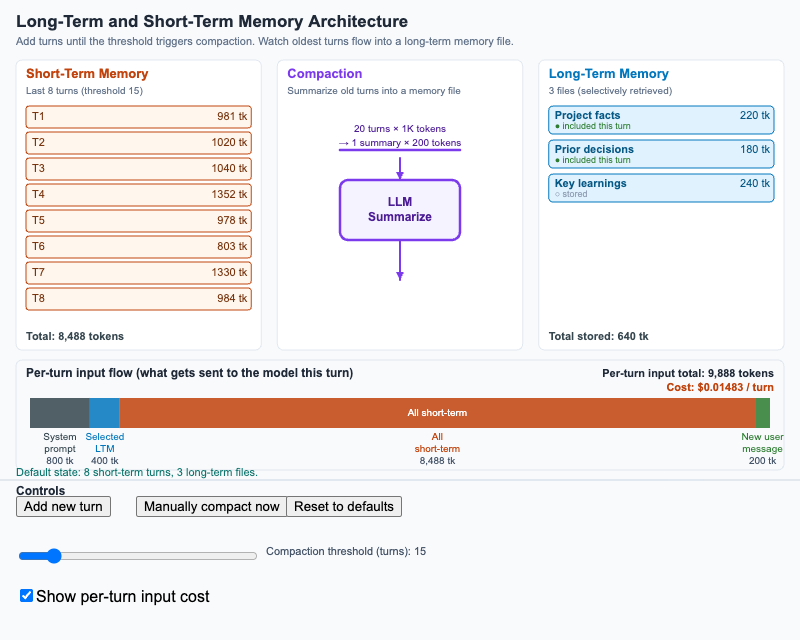
Three-column diagram showing how short-term conversation turns flow through compaction into long-term memory files, with a per-turn input flow at the bottom.
-
OpenAI Token Usage Object Anatomy
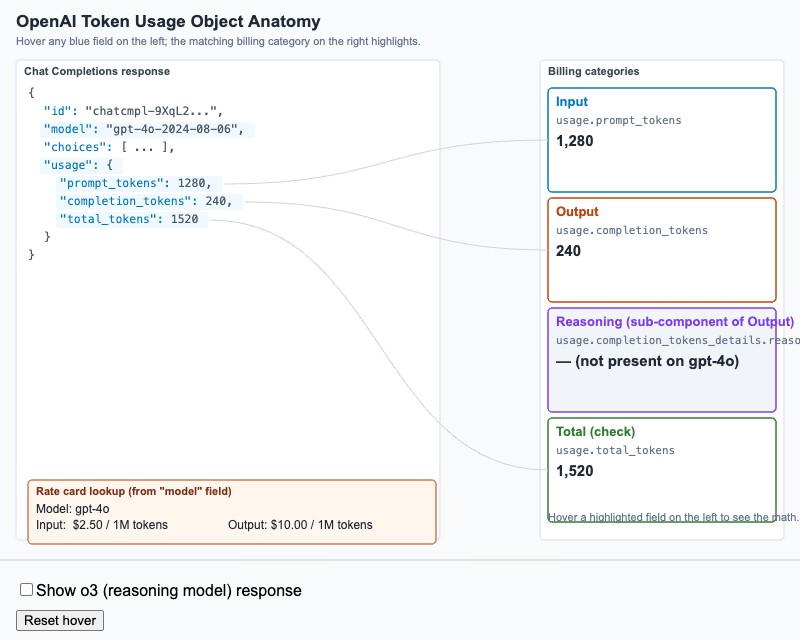
Hover-labeled anatomy of an OpenAI Chat Completions response showing how each usage field maps to a billing category, including reasoning_tokens for o-series models.
-
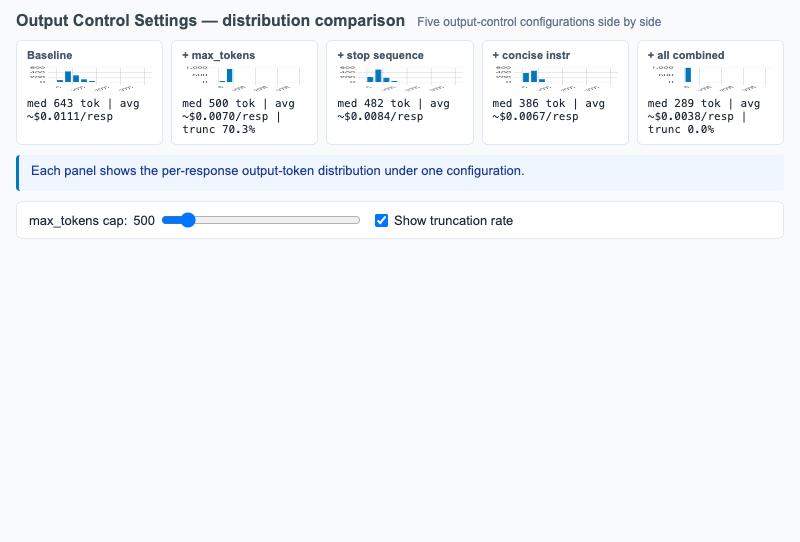
Five histogram comparison of output token distributions under baseline, max_tokens, stop sequence, concise instruction, and all-combined configurations.
-
Pareto Analysis of Per-Feature Cost
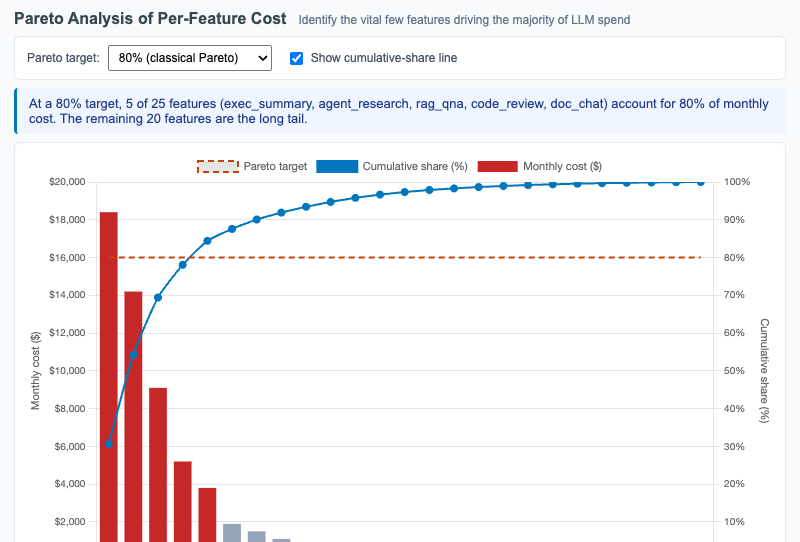
Interactive Chart.js Pareto chart showing 25 features sorted by monthly LLM cost with overlaid cumulative-share line and adjustable Pareto target threshold.
-
Precision/Recall Tradeoff for K Selection
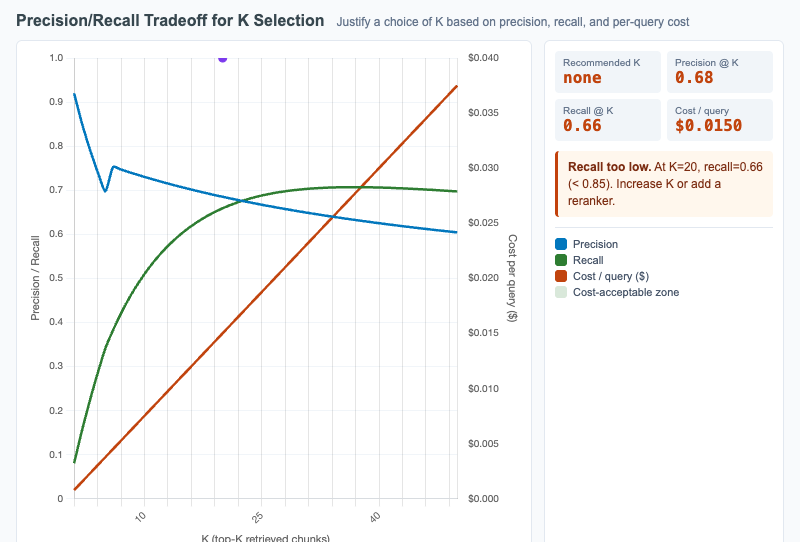
Plot retrieval precision and recall as functions of K with per-query cost overlaid, so learners can justify the K that balances quality and cost.
-
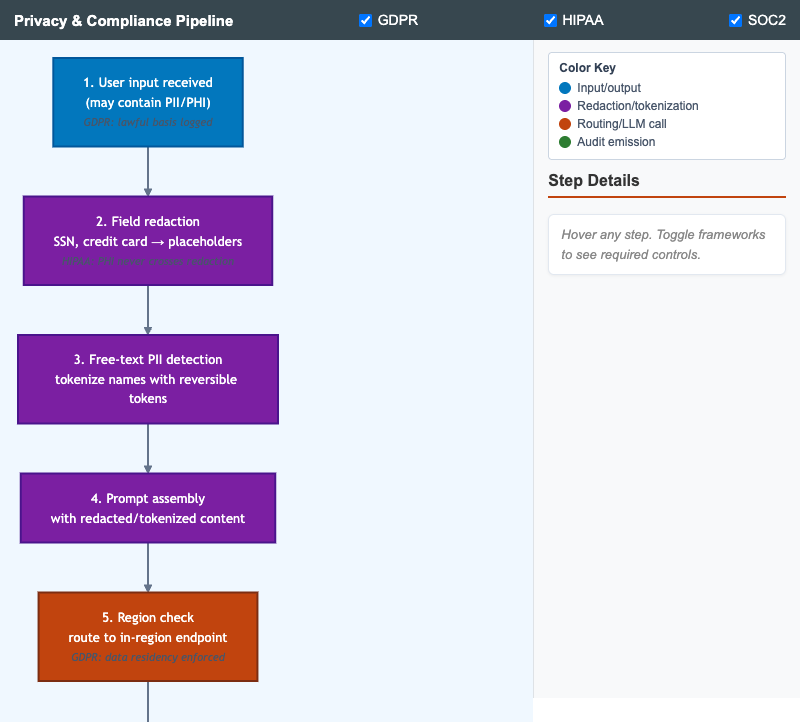
Vertical pipeline showing the layered privacy and compliance controls a single LLM request flows through, with framework annotations toggleable per regulation.
-
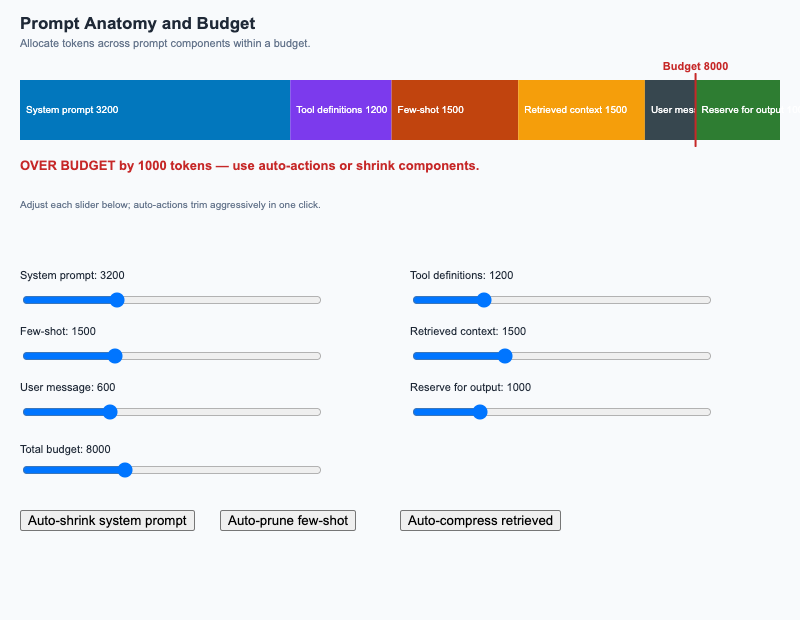
Stacked bar of prompt components against a budget overlay; sliders adjust component sizes and auto-actions trim aggressively.
-
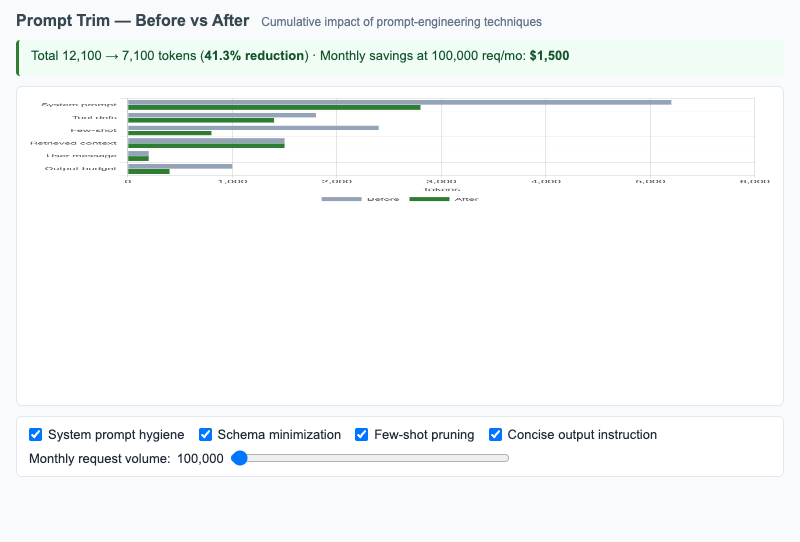
Grouped horizontal bars comparing token counts per prompt section before and after prompt-engineering techniques, with monthly savings projection.
-
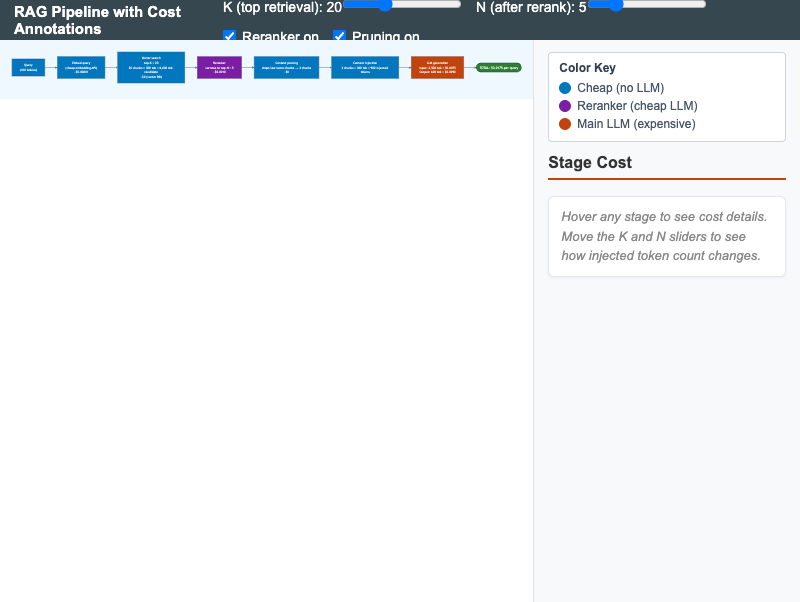
Horizontal RAG pipeline with live cost annotations at each stage; sliders adjust top-K and reranker N to surface the cost-leverage points.
-
Sample Size Calculator for LLM A/B Tests
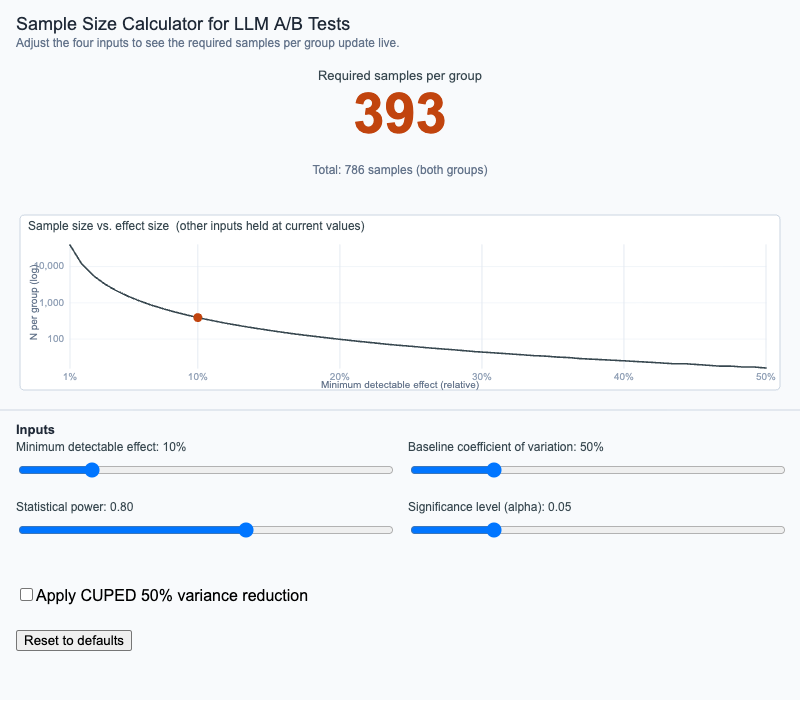
Adjust effect size, baseline variance, statistical power, and significance level to see the required sample size update live, with optional CUPED variance reduction.
-
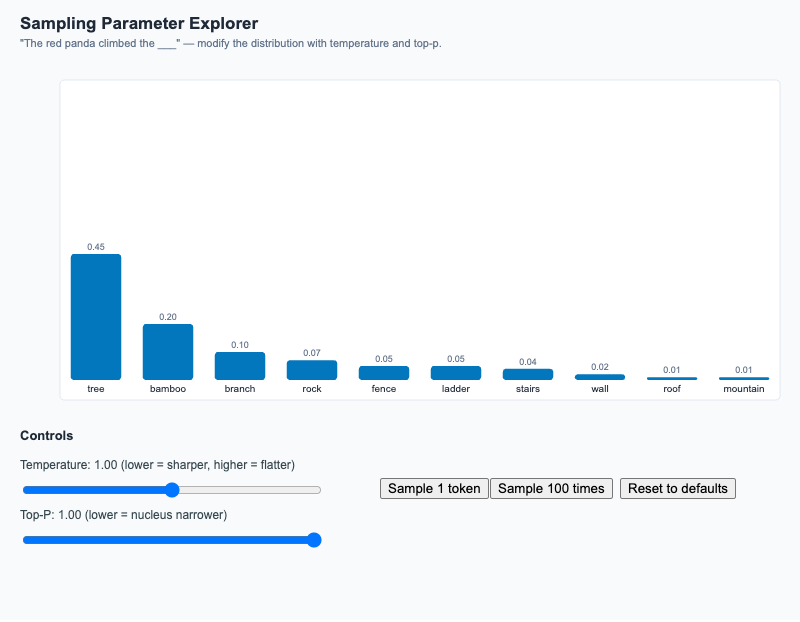
Adjust temperature and top-p, watch the candidate-token distribution reshape, then sample once or 100 times to see empirical vs theoretical frequencies.
-
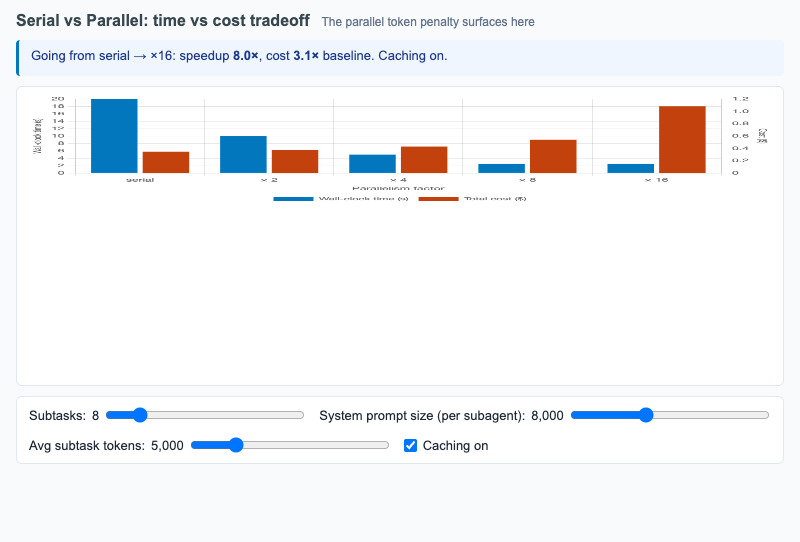
Dual-axis bar chart of wall-clock time and total token cost as parallelism grows from 1 to 16, surfacing the parallel token penalty.
-
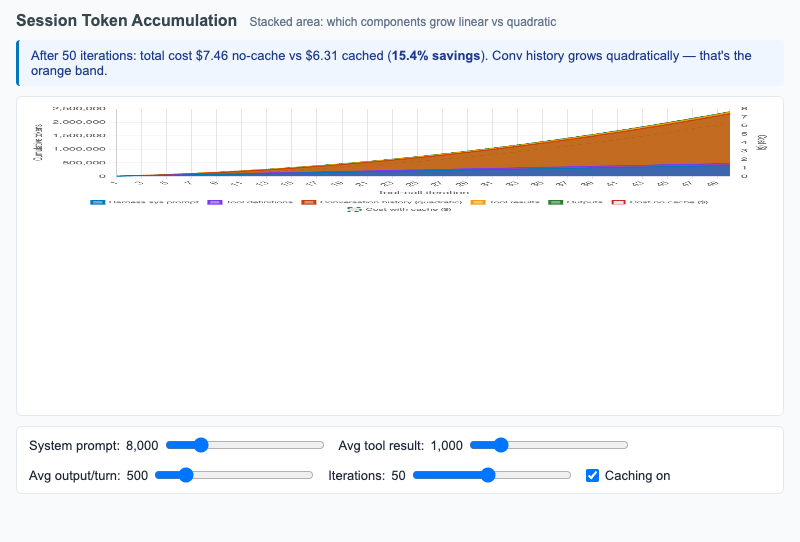
Stacked area chart showing how harness sessions accumulate tokens turn by turn — surfacing the quadratic growth of conversation history.
-
Skill Refactoring Before/After
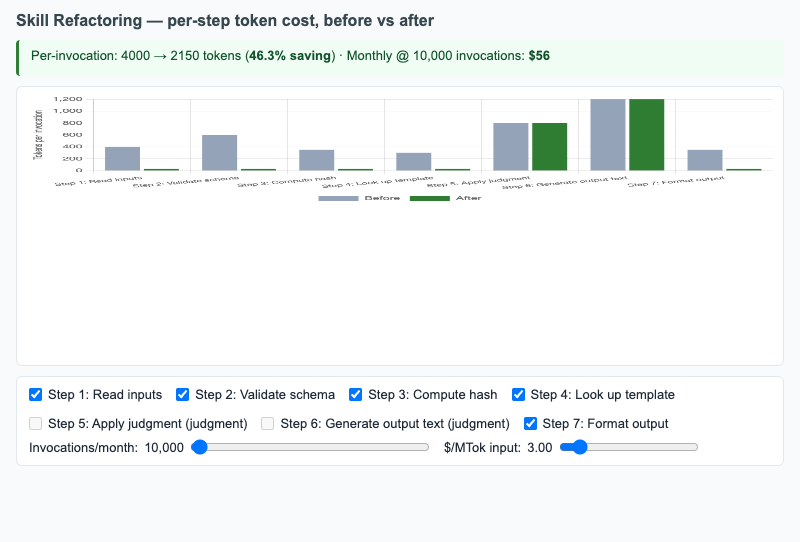
Per-step token cost of a Skill before and after script-delegation refactor; toggle each step to see the cumulative monthly-savings projection.
-
Stable Prefix / Volatile Suffix
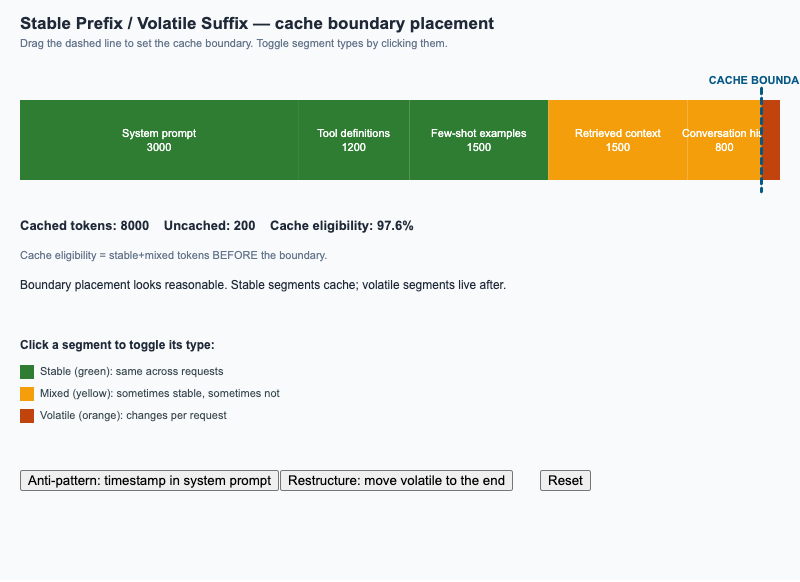
Drag the cache boundary on a segmented prompt; toggle each segment between stable and volatile; see cache eligibility update in real time.
-
Sync, Async, and Batch API Flow
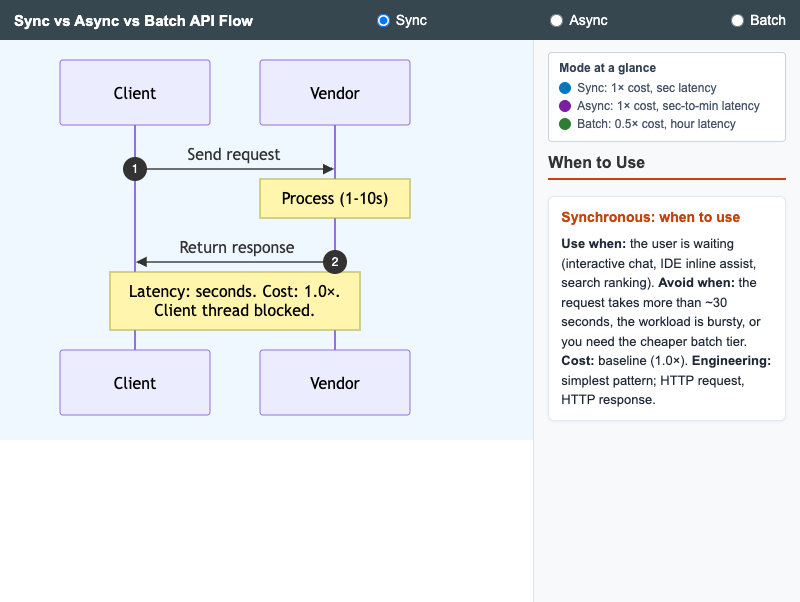
Three side-by-side sequence diagrams comparing synchronous, asynchronous, and batch LLM API modes with cost and latency annotations.
-
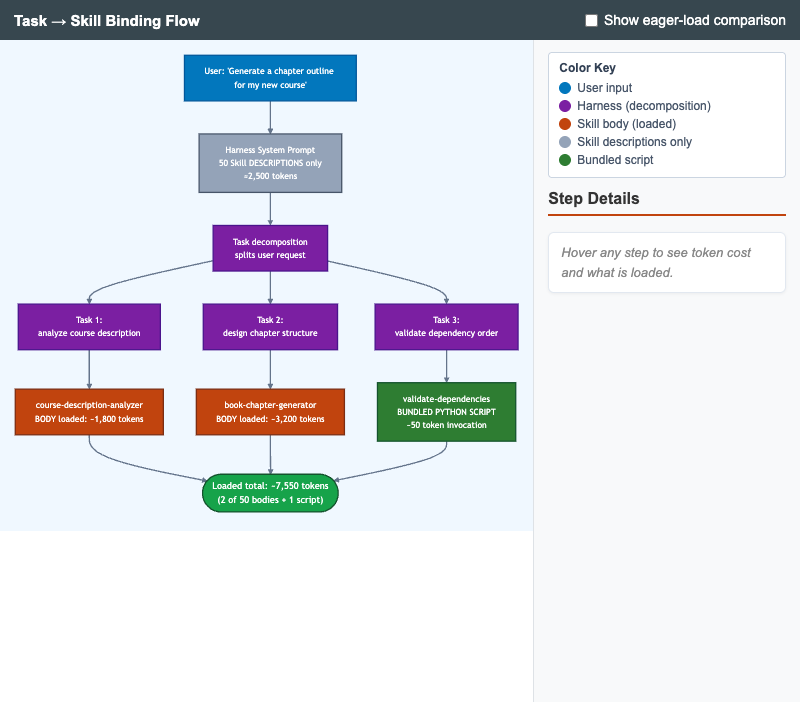
Diagram of how a harness decomposes a user request into tasks and binds each to a Skill, with token-cost annotations comparing lazy load vs eager load.
-
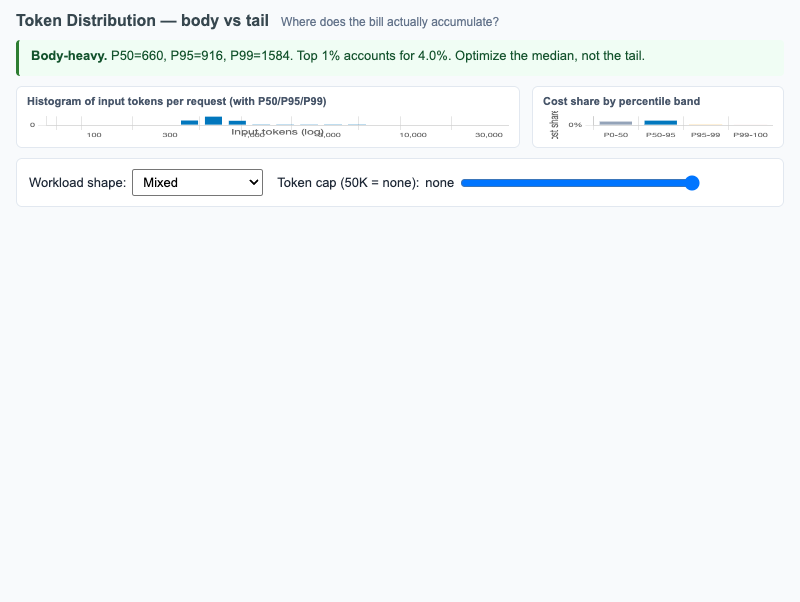
Histogram of per-request input tokens with P50/P95/P99 markers plus cost-share-by-percentile-band, surfacing whether a workload is body-heavy or tail-heavy.
-
Token Lifecycle from Input to Output
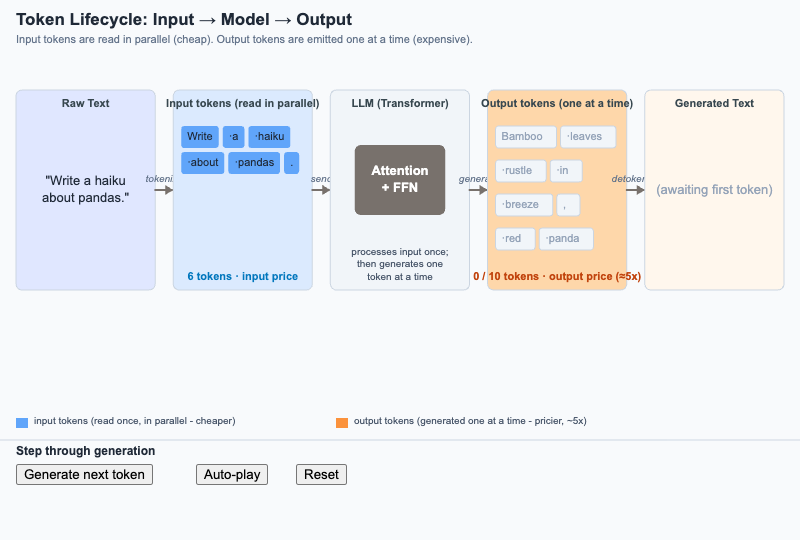
Step through how raw text becomes input tokens, gets processed once by the model, and is emitted as output tokens one at a time - the asymmetry that drives pricing.
-
Token Spike Alert with Drill-Down
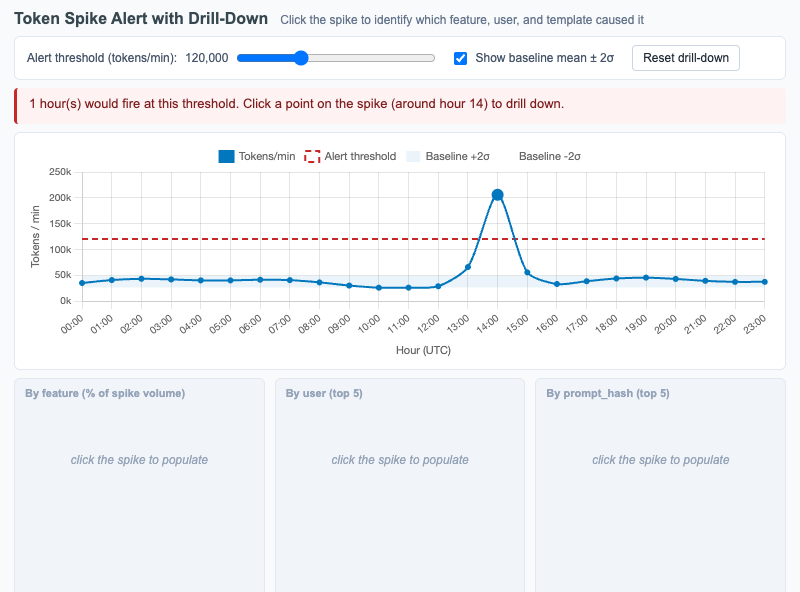
Interactive Chart.js time series of tokens-per-minute over 24 hours with a click-to-reveal drill-down by feature, user, and prompt template that explains the cause of a spike.
-
Tool Use Loop with Cost Annotations

Multi-turn Anthropic tool-use sequence diagram with cumulative token annotations showing why the system prompt and tool definitions are the highest-value cache targets.