List of MicroSims
Interactive Micro Simulations to help students learn AP US Government and Politics fundamentals.
-
AI Threat Taxonomy for Elections
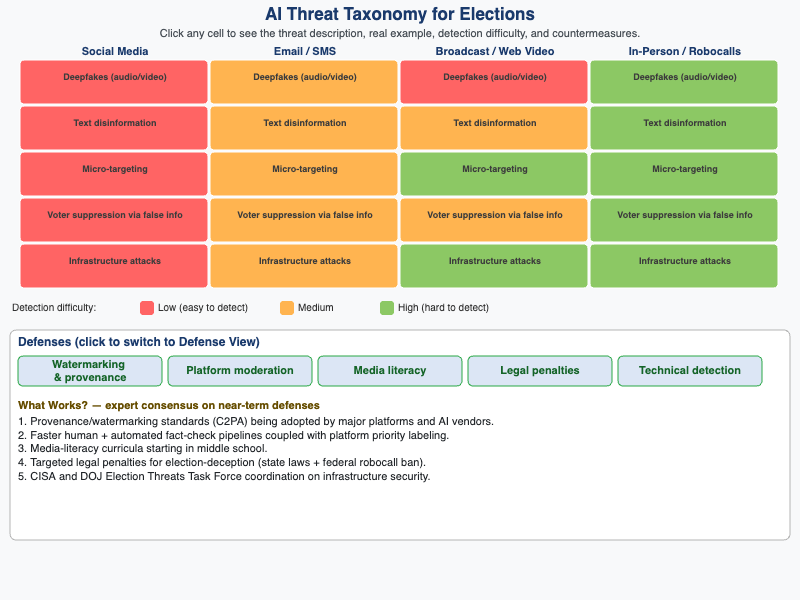
Interactive risk map where students classify AI-enabled election threats and evaluate the effectiveness of proposed countermeasures.
-
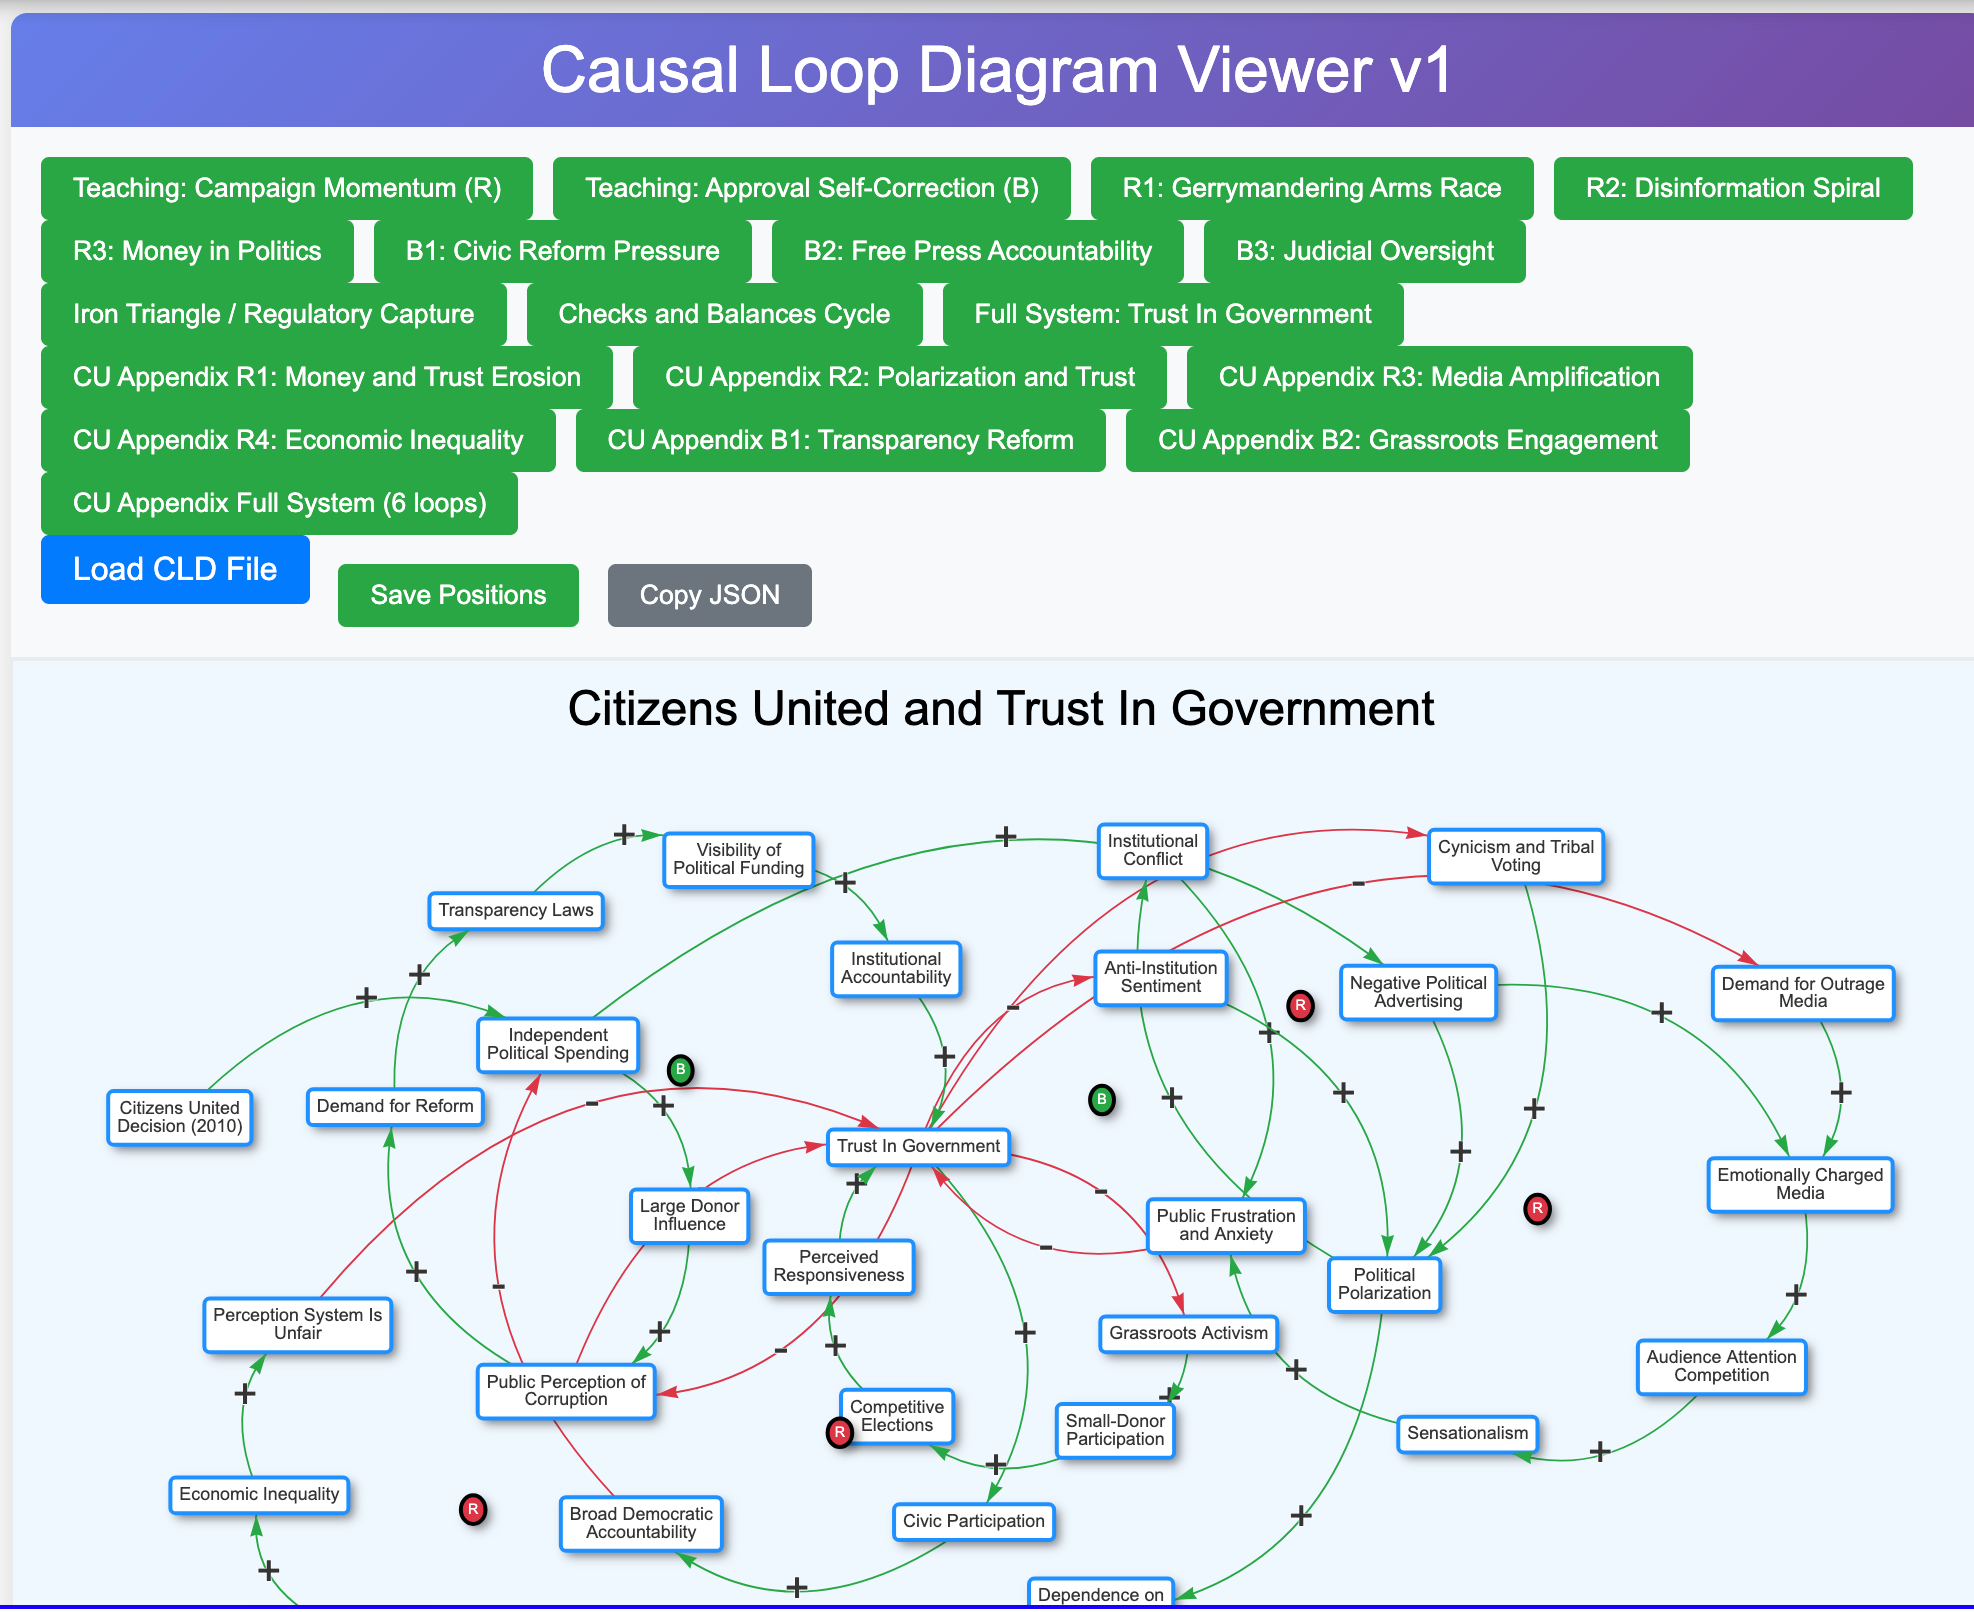 A shared fullscreen viewer for browsing and editing the causal loop diagrams used across this textbook. Load any CLD file, drag nodes to reposition them, and explore feedback loops.
 -
Checks and Balances Among the Three Branches
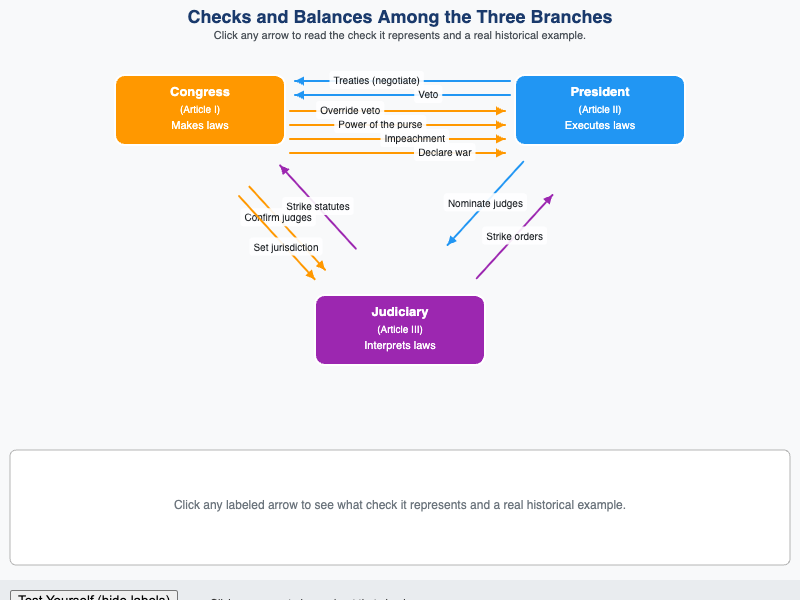
Identifies each constitutional check and explains how it prevents any single branch from accumulating too much power.
-
Civil Rights Milestones — Legal and Legislative Timeline
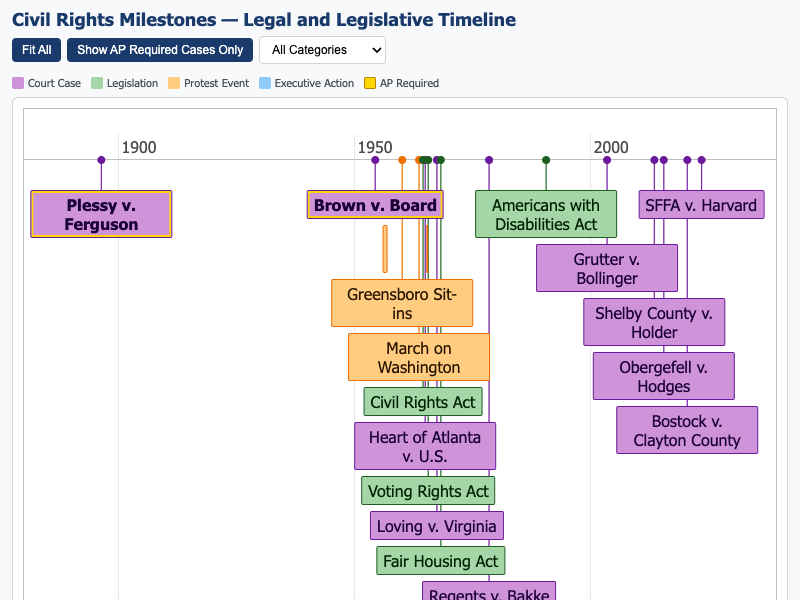
Chronological timeline of major civil rights milestones showing how legal decisions and legislation built upon each other.
-
Cognitive Bias in Political Reasoning
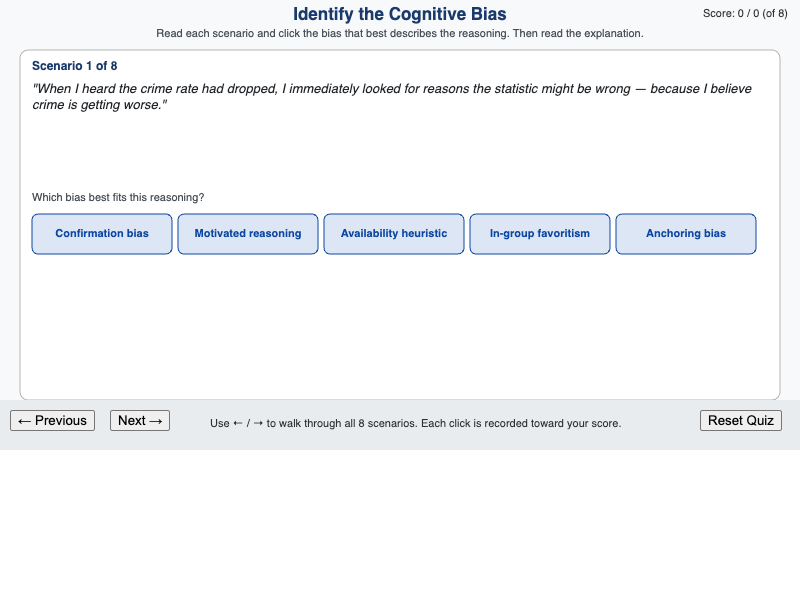
Scenario-based explorer where students classify political reasoning examples as confirmation bias, motivated reasoning, availability heuristic, in-group favoritism, or anchoring.
-
Constitutional Amendment Timeline
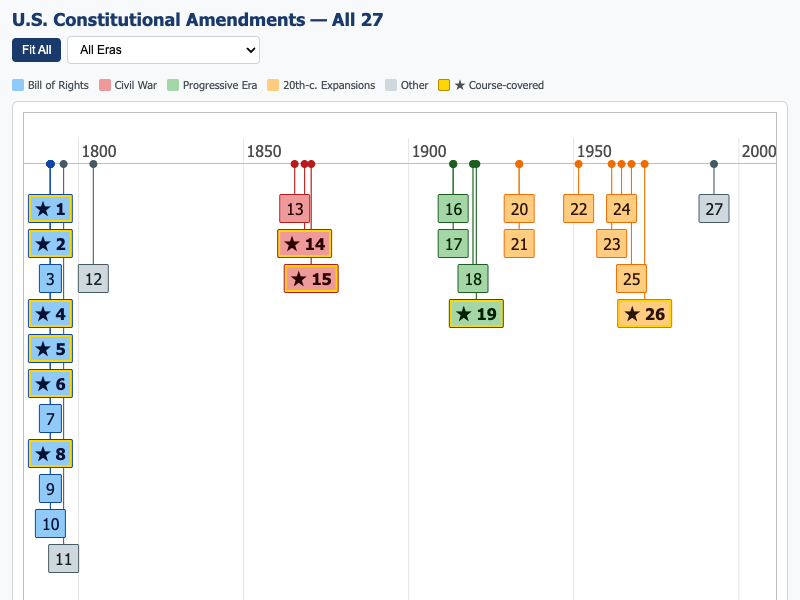
Interactive timeline identifying constitutional amendments and the historical context that drove each ratification.
-
Corruption Perceptions Index — Western Democracies
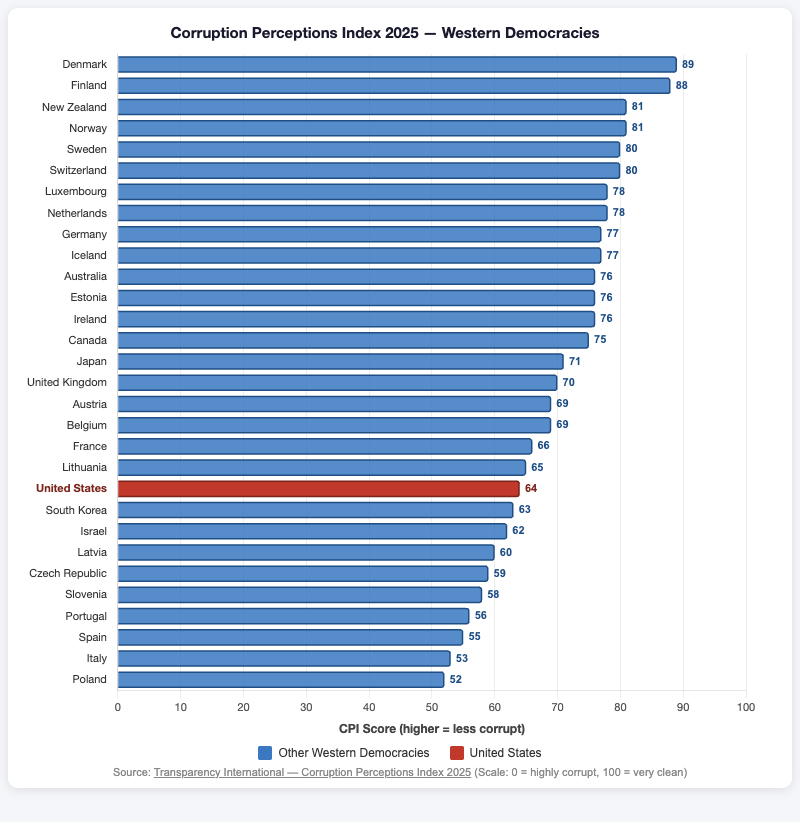
Horizontal bar chart comparing Corruption Perceptions Index scores across 30 Western democracies, with the United States highlighted.
-
Electoral College — Interactive Map
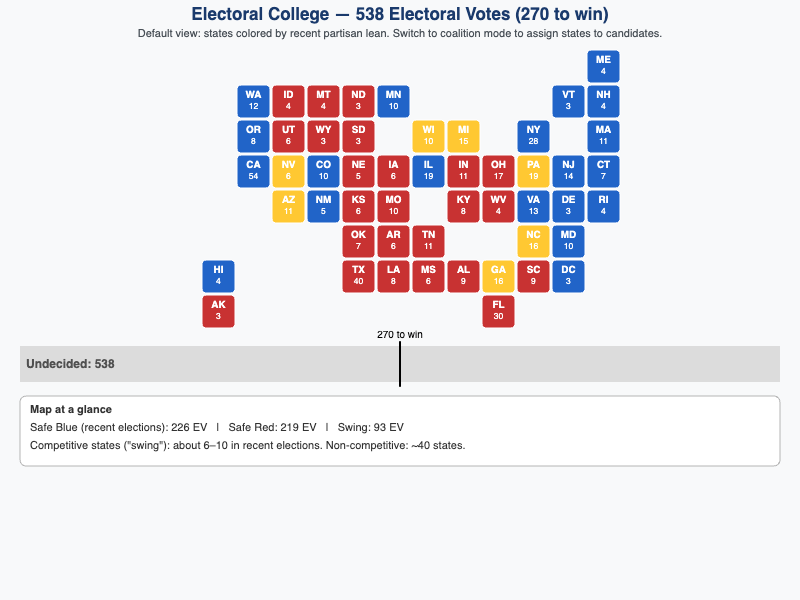
Interactive map explaining how the Electoral College works and how winner-take-all rules concentrate campaign attention in swing states.
-
Enlightenment Ideas to American Institutions
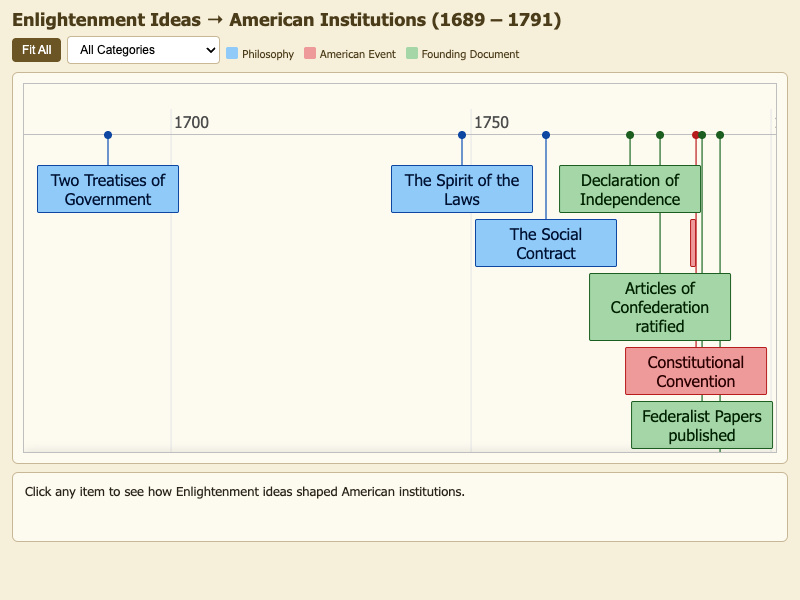
Connects key Enlightenment thinkers to the specific founding documents and constitutional structures they influenced.
-
Federalism Evolution — From Dual to Cooperative to New

Timeline showing how the balance of power between national and state governments has shifted across historical eras and what drove those changes.
-
Gerrymandering — Packing and Cracking Visualized
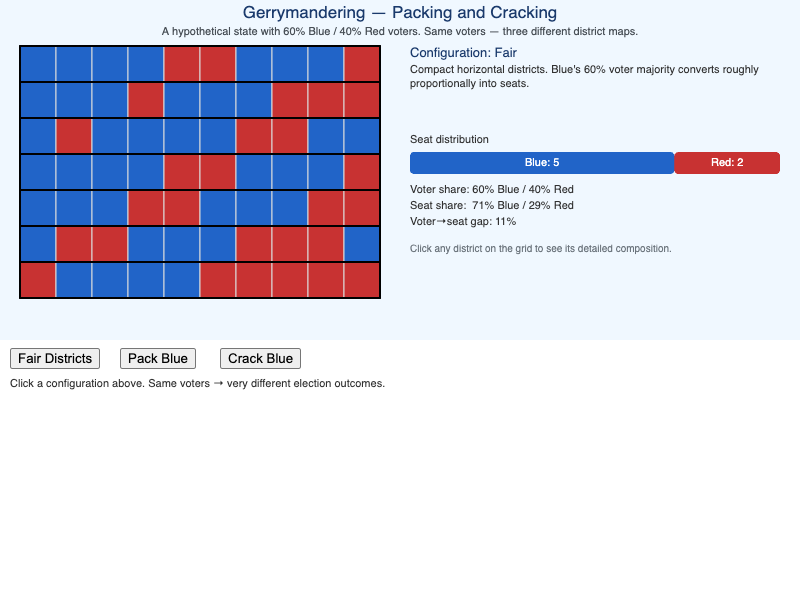
Grid-based visualization demonstrating how district boundary drawing affects election outcomes through packing and cracking strategies.
-
Government Trust Trend (1958–2025)
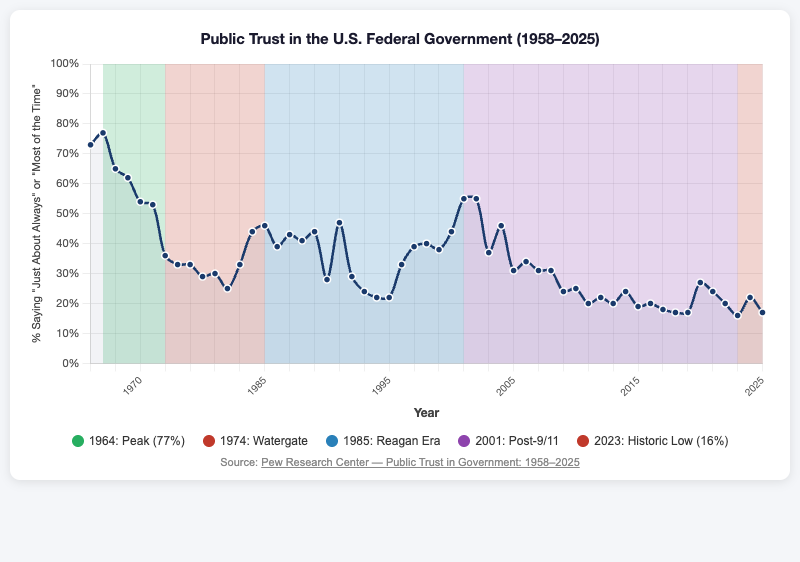
Interactive line chart showing how public trust in the U.S. federal government has changed from 1958 to 2025 based on Pew Research Center data.
-
Great Compromise — The Two-Chamber Solution
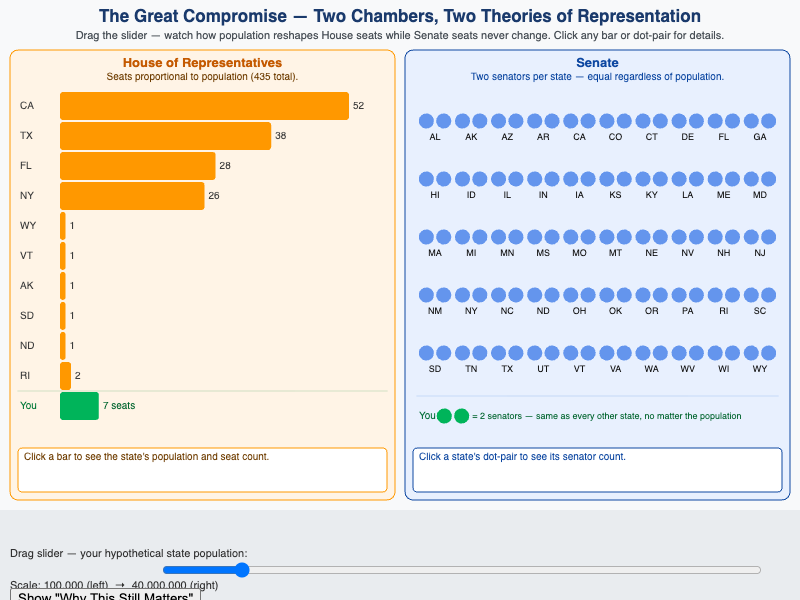
Explains how the Great Compromise resolved the conflict between large-state and small-state interests by creating a bicameral legislature.
-
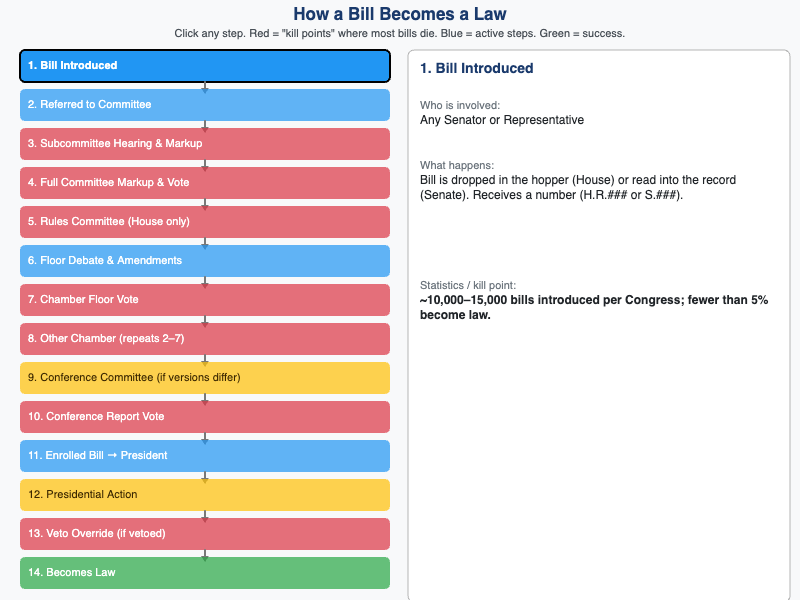
Step-by-step flowchart of the legislative process from introduction through presidential action and possible veto override.
-
Iron Triangle vs. Issue Network — Structural Comparison
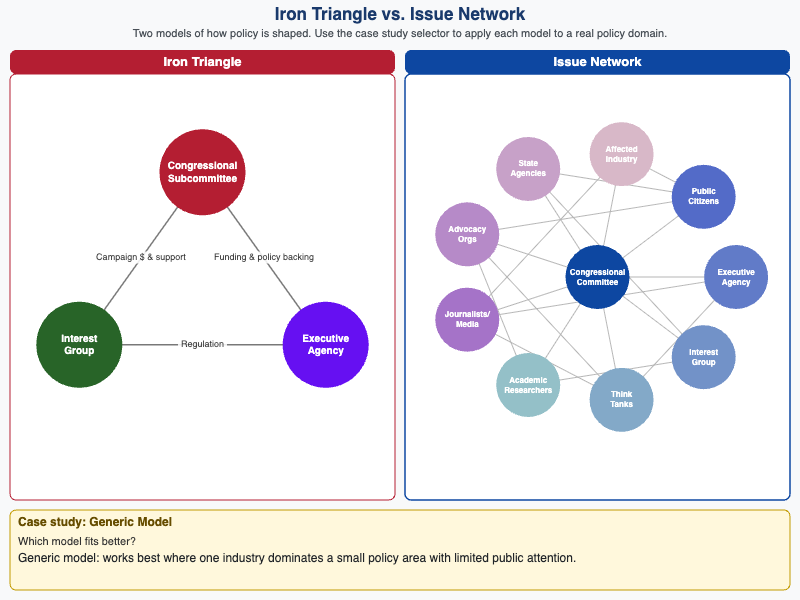
Structural comparison of iron triangle and issue network models of policy influence applied to contemporary policy domains.
-
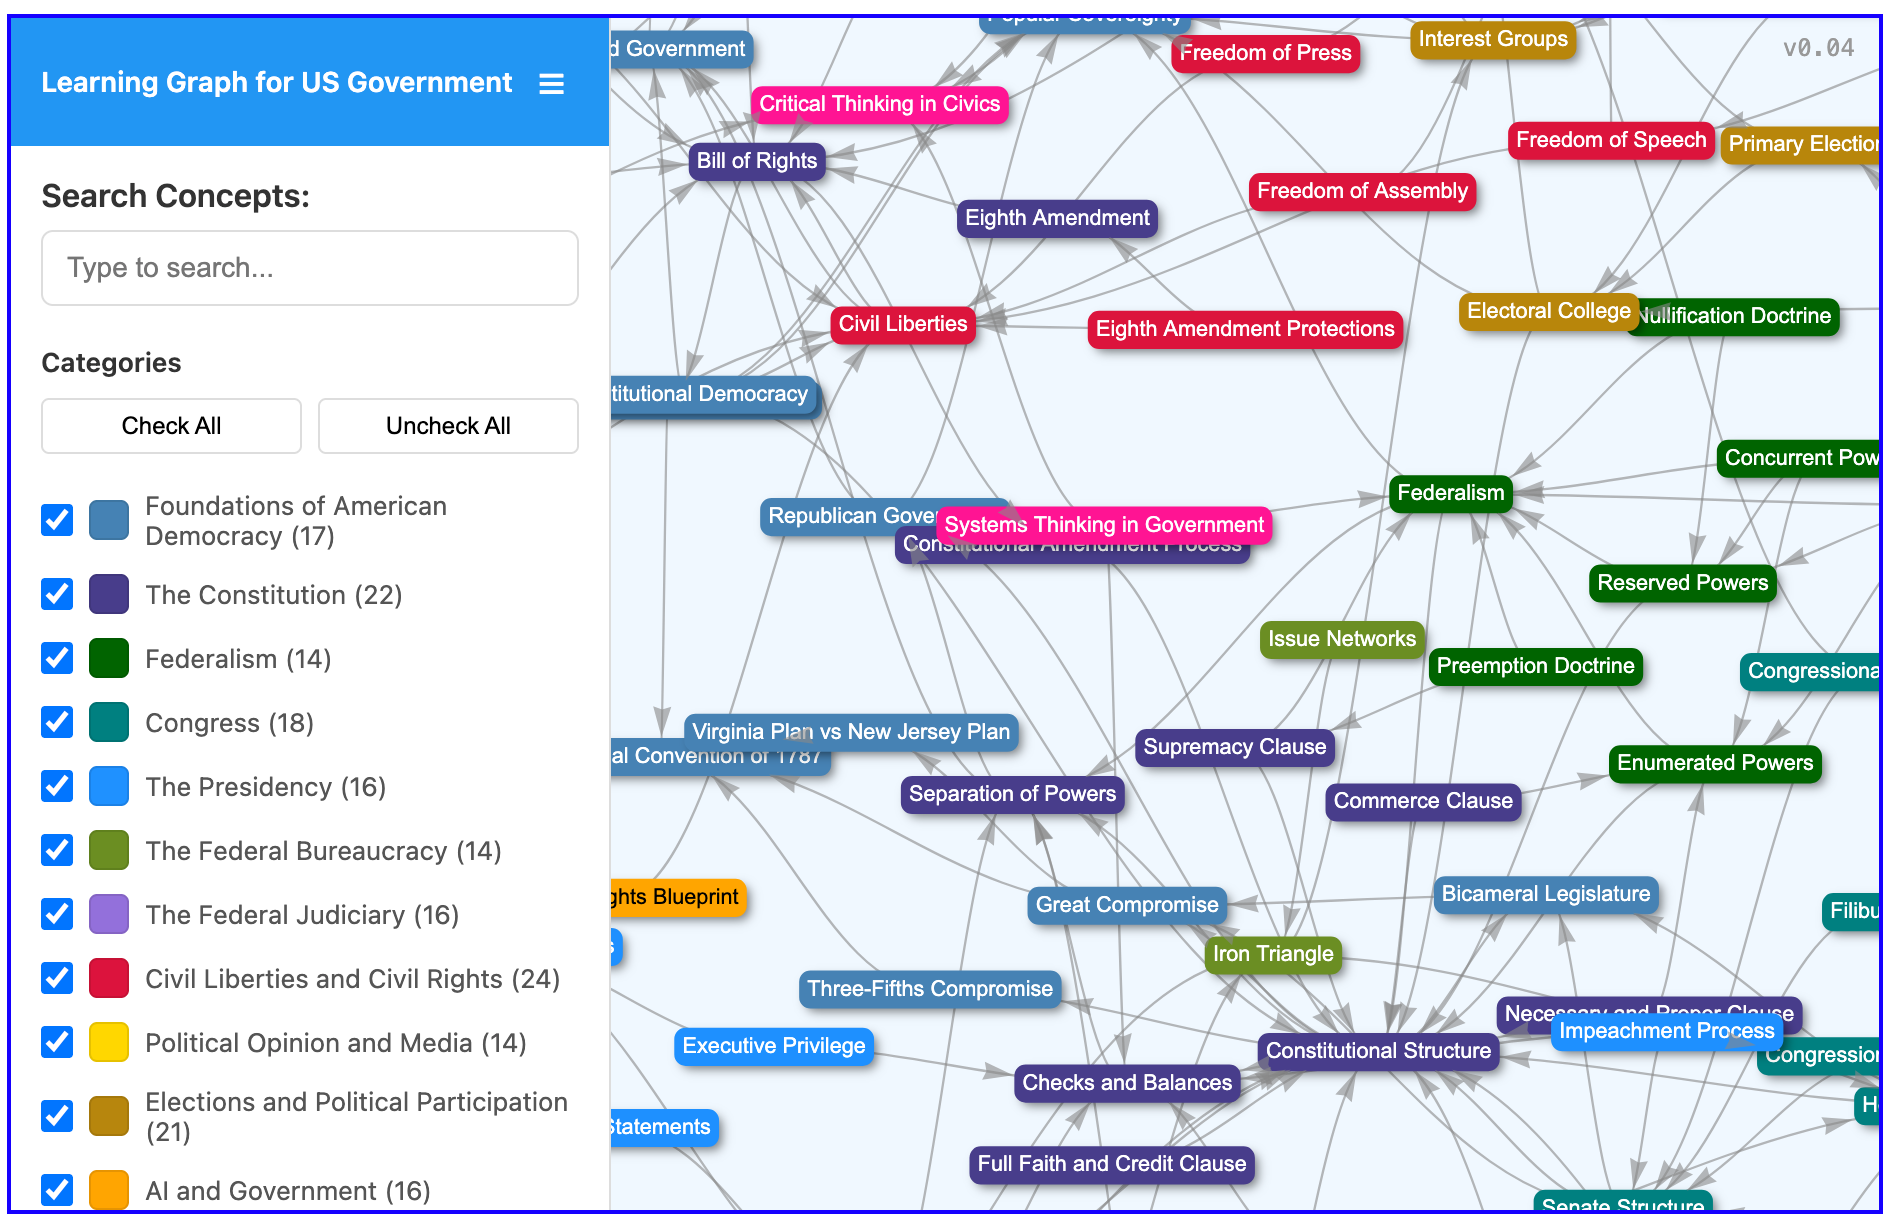
View the concepts for this course as a directed graph with links showing dependencies between topics.
-
Powers Comparison — Articles vs. Constitution
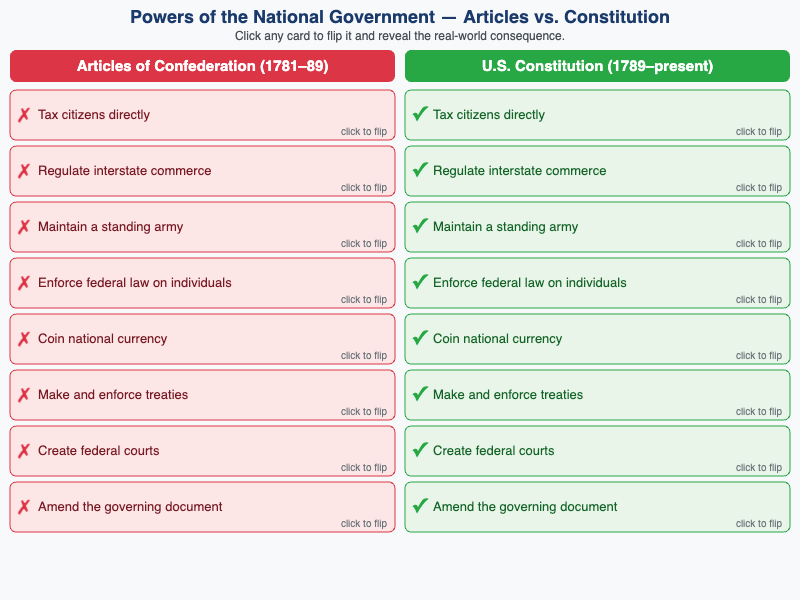
Side-by-side comparison of the powers granted to the national government under the Articles of Confederation versus the Constitution.
-
Presidential Power — Formal vs. Informal Sources
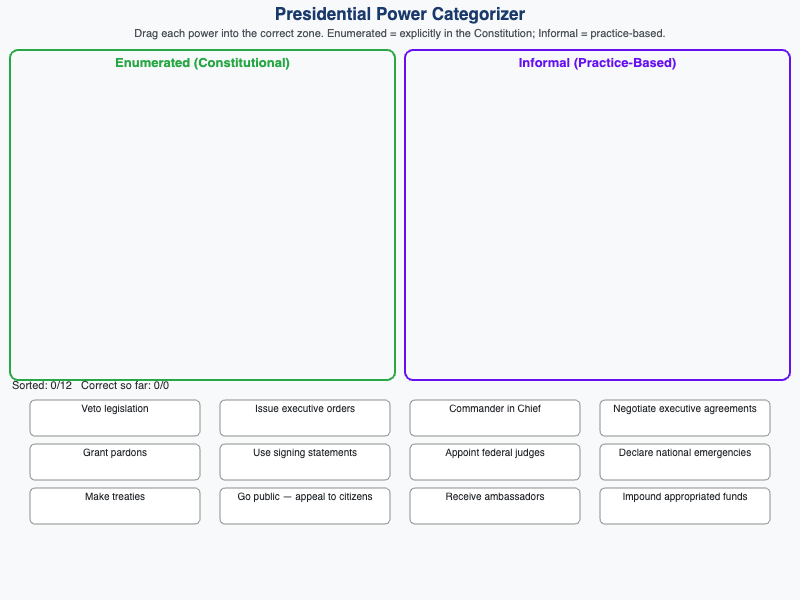
Classify presidential powers as enumerated (constitutional) or informal (practice-based) and apply the distinction to novel scenarios.
-
Spoils System vs. Merit System
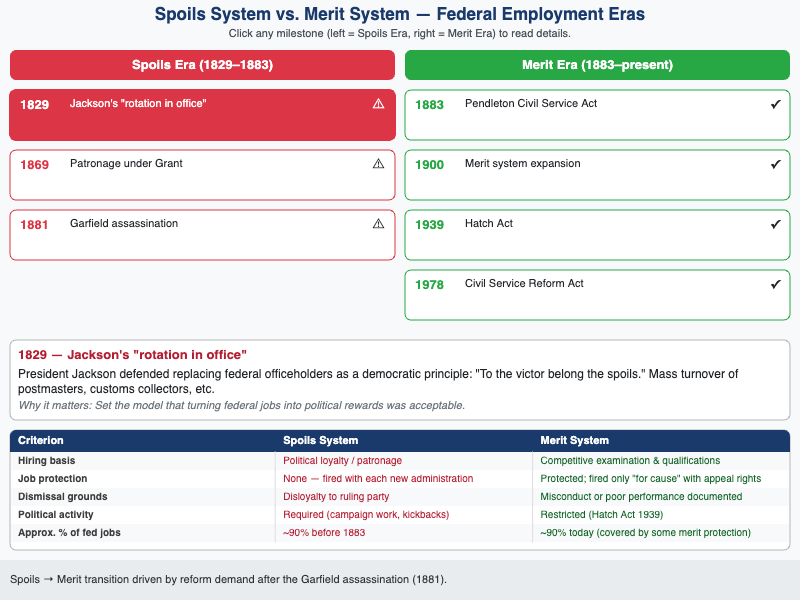
Timeline comparing the spoils and merit systems of federal employment and explaining why the Pendleton Act transition occurred.
-
The Grants Spectrum — Categorical to Block
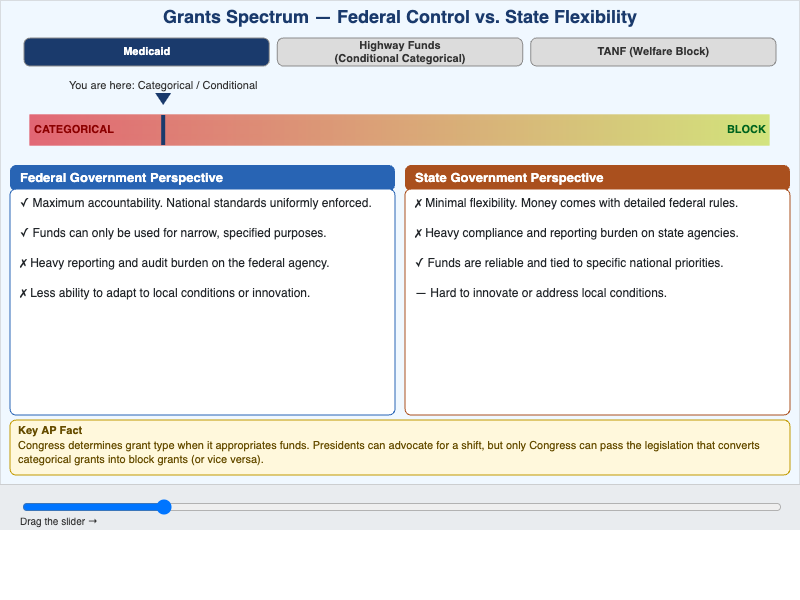
Interactive slider contrasting categorical and block grants, exploring trade-offs between federal accountability and state flexibility.
-
Three-Tier Federal Court Hierarchy
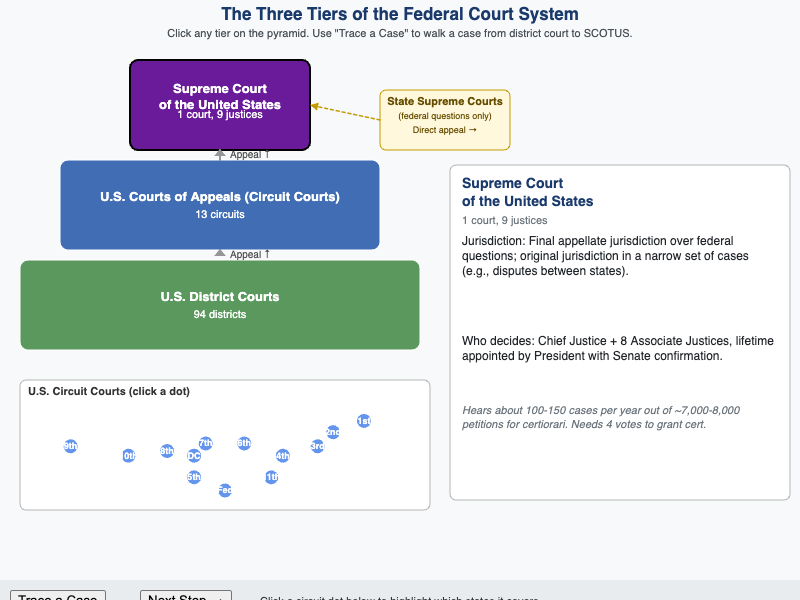
Identifies the three tiers of the federal court system and explains the jurisdiction each tier exercises and how cases move between levels.
-
Trust In Government Causal Loop Diagram
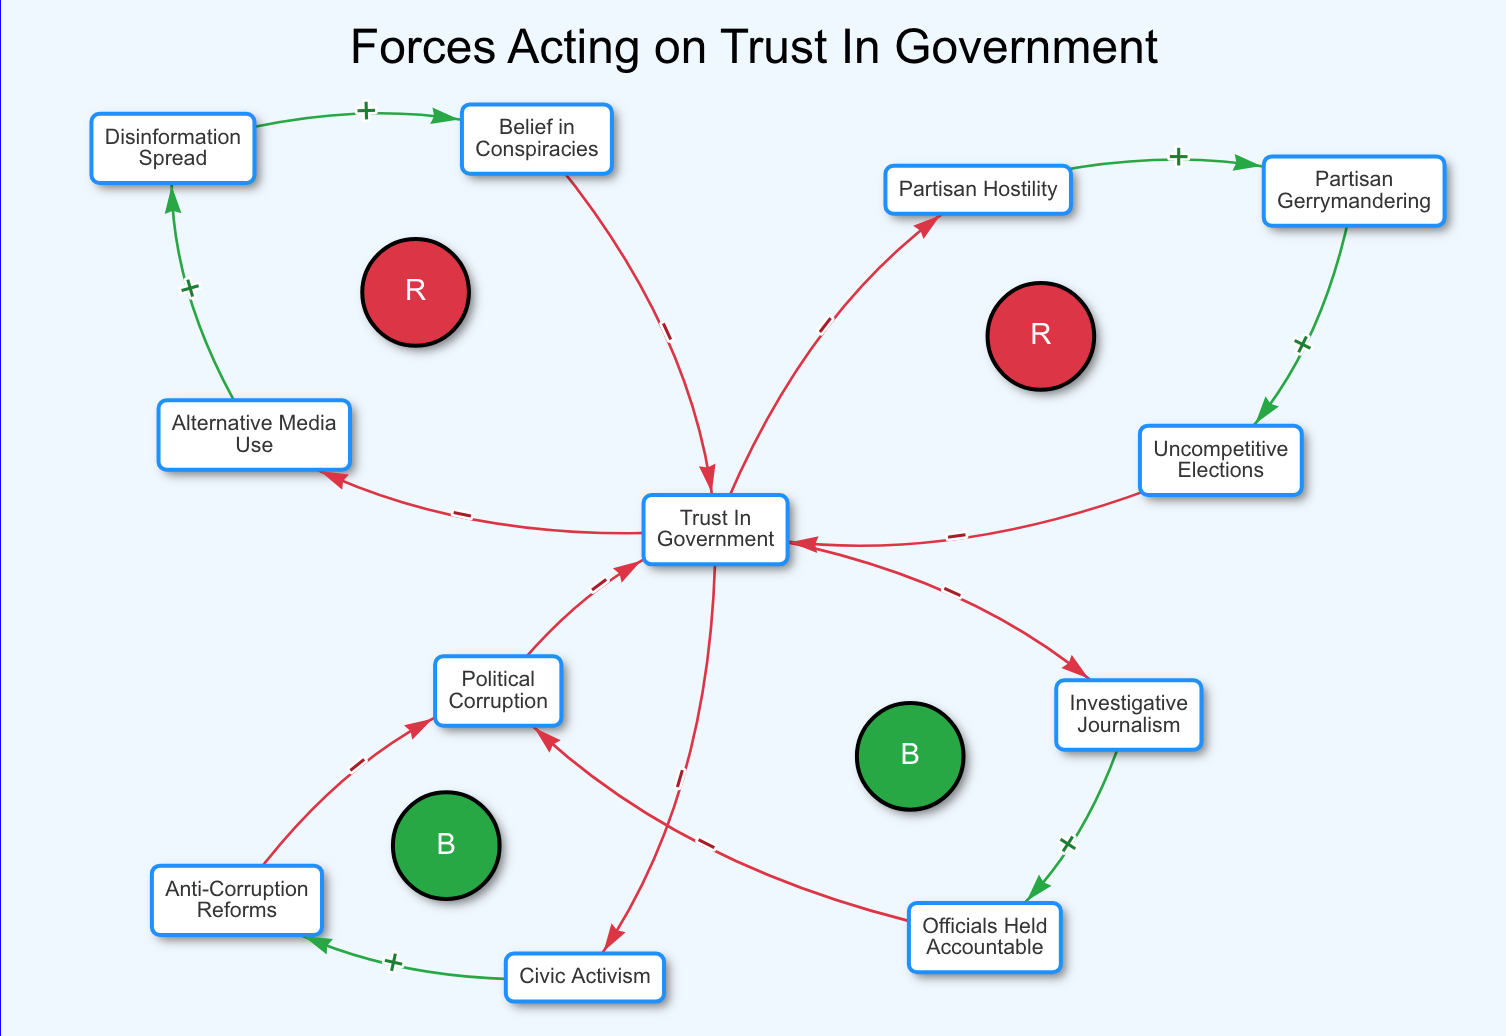
Systems-thinking view of the forces eroding and restoring trust in the U.S. government across four reinforcing and balancing feedback loops.
-
Understanding Polling — Margin of Error
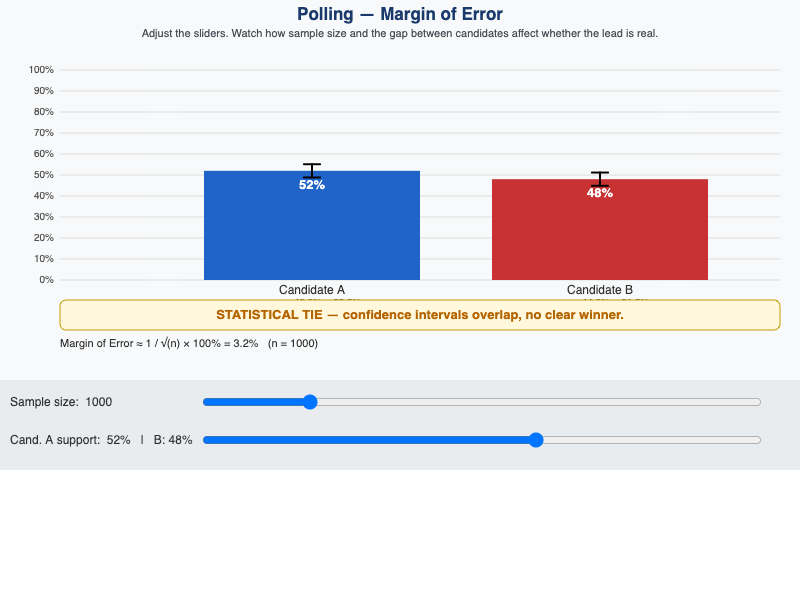
Interactive simulation for interpreting polling data including margin of error to distinguish statistically significant differences from statistical ties.