List of MicroSims
Interactive Micro Simulations to help students explore mythical beasts, AI hype, technology fantasy, and the fine art of spotting unicorns in the wild.
-
Adaptive Learning Feedback Loop
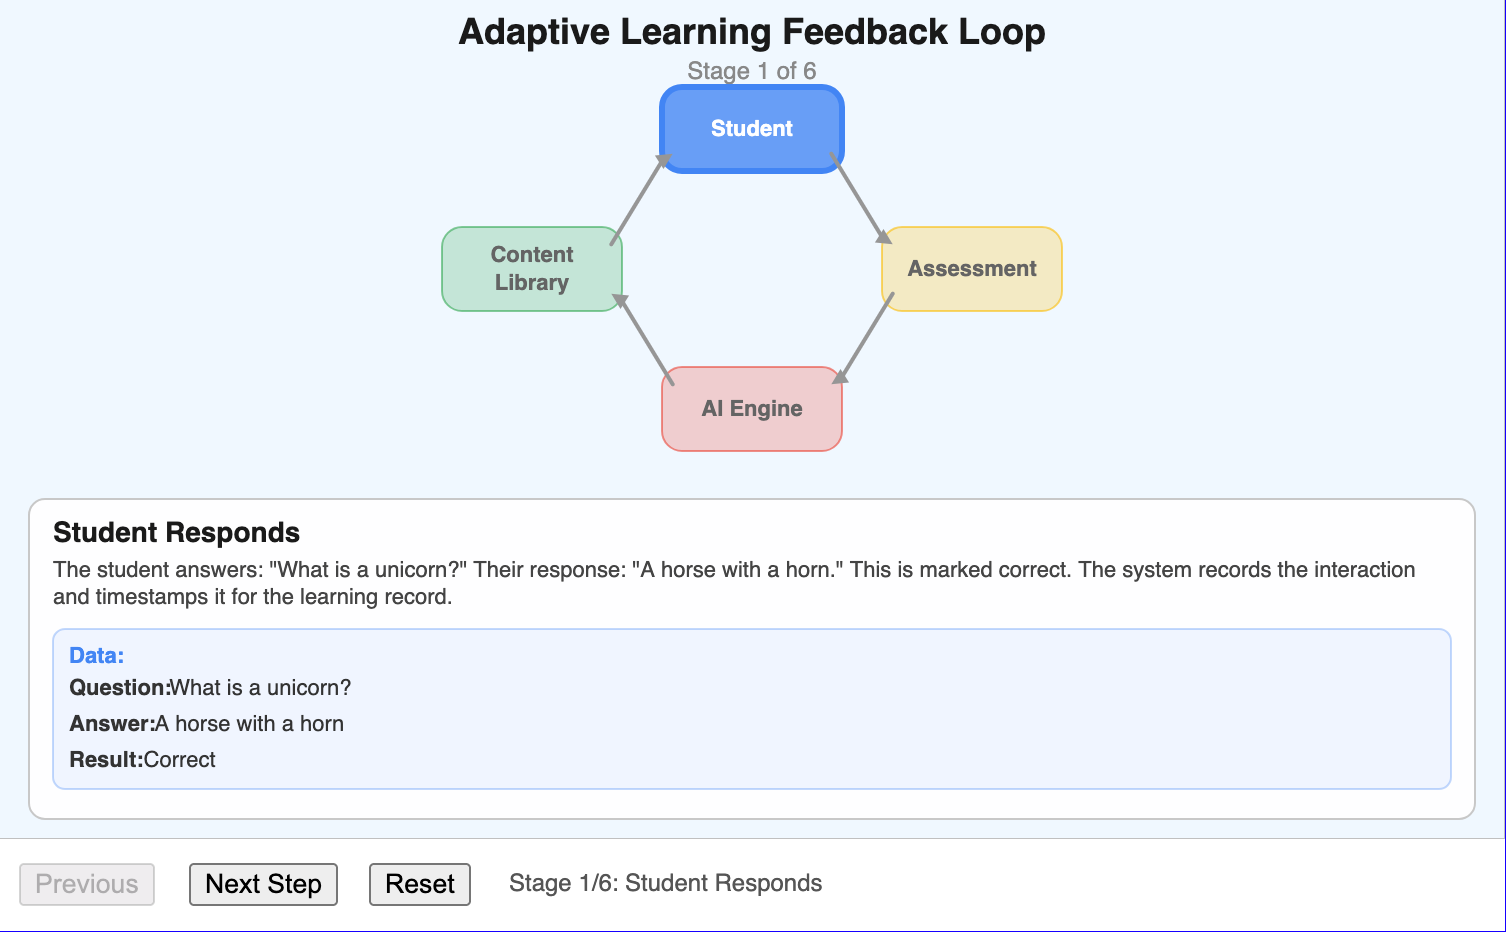
Step-through visualization showing how an adaptive learning system adjusts content based on student performance.
-
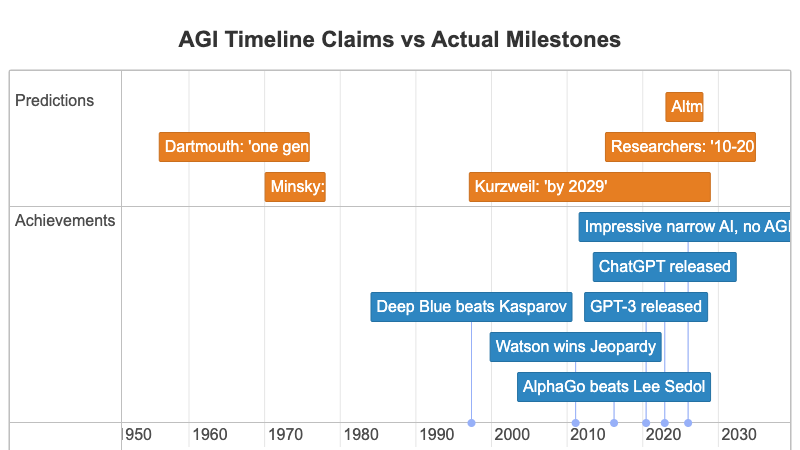
Interactive timeline comparing AGI predictions against actual AI milestones, revealing the persistent gap.
-
AI Hype Cycle with Mythical Beasts
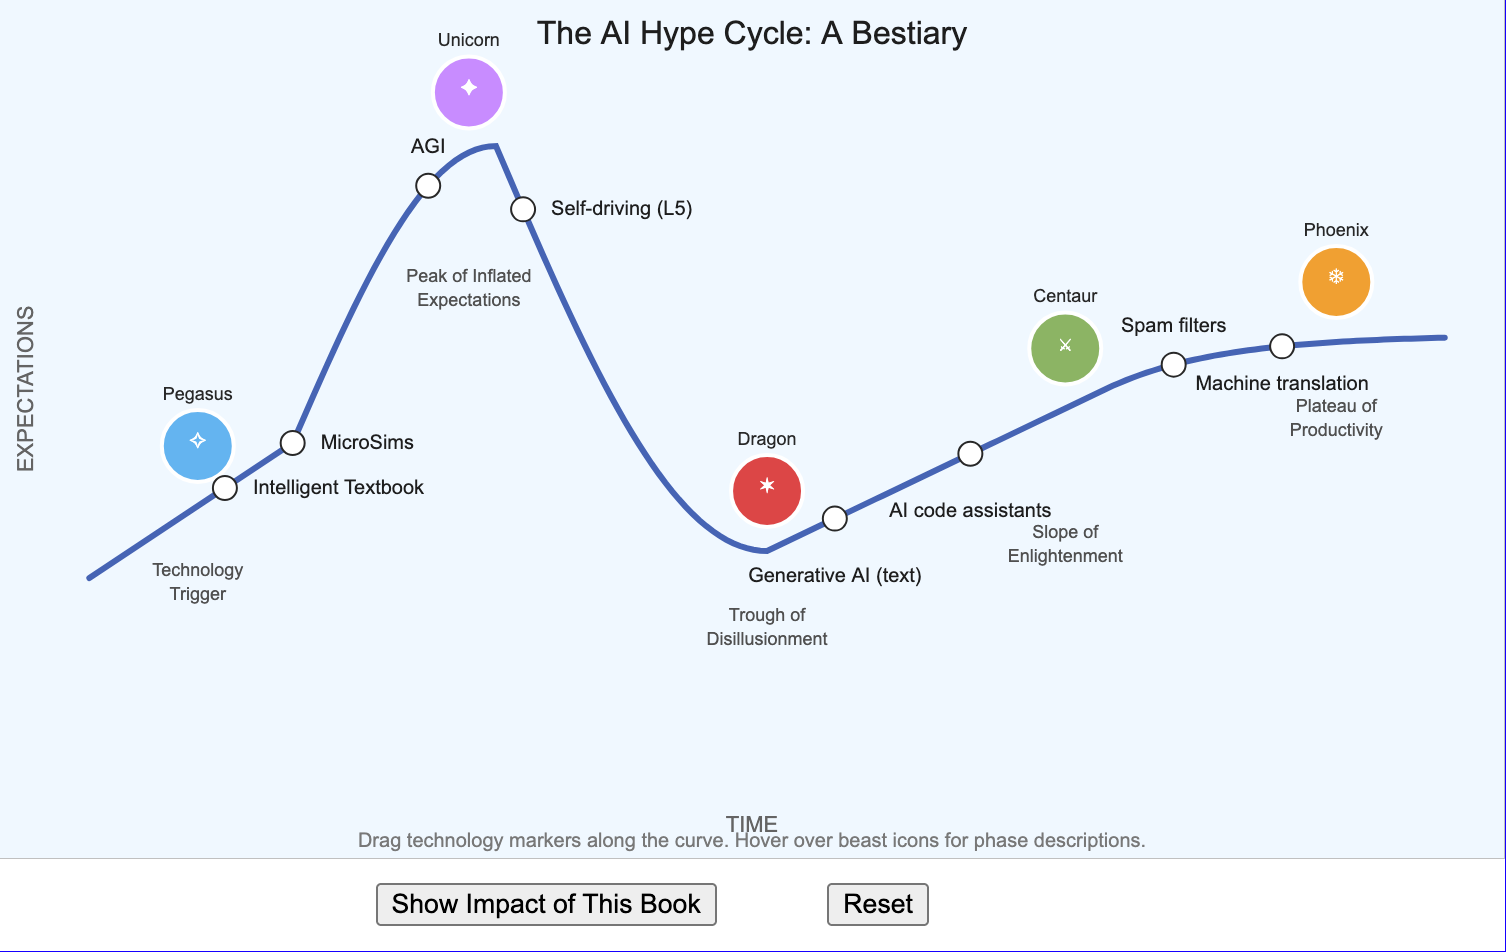
Interactive hype cycle curve with AI technologies plotted and mythical beasts marking each phase.
-
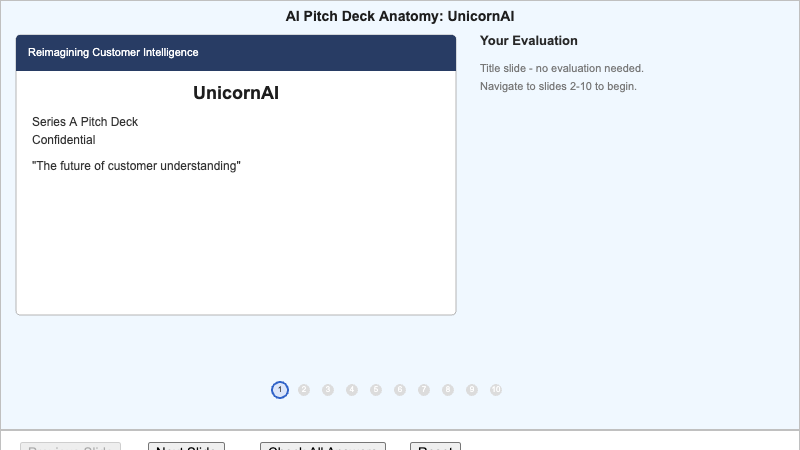
Interactive pitch deck viewer where students evaluate claims on each slide using a traffic-light rating system.
-
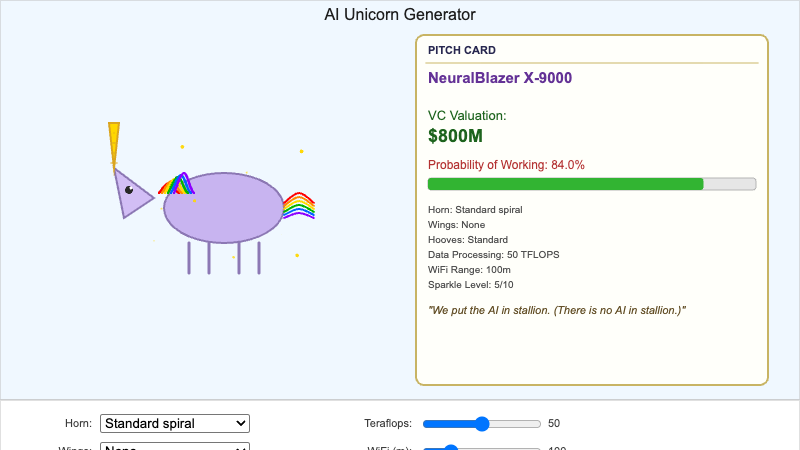
Configure an AI-enhanced unicorn by selecting features and see the resulting satirical venture capital valuation.
-
Ancient Unicorn Civilizations Map
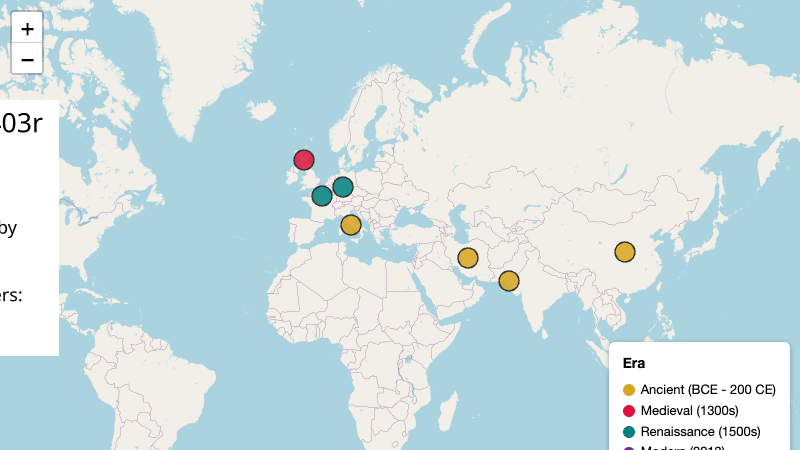
Interactive map showing historical unicorn sightings and cultural references from 2600 BCE to Silicon Valley.
-
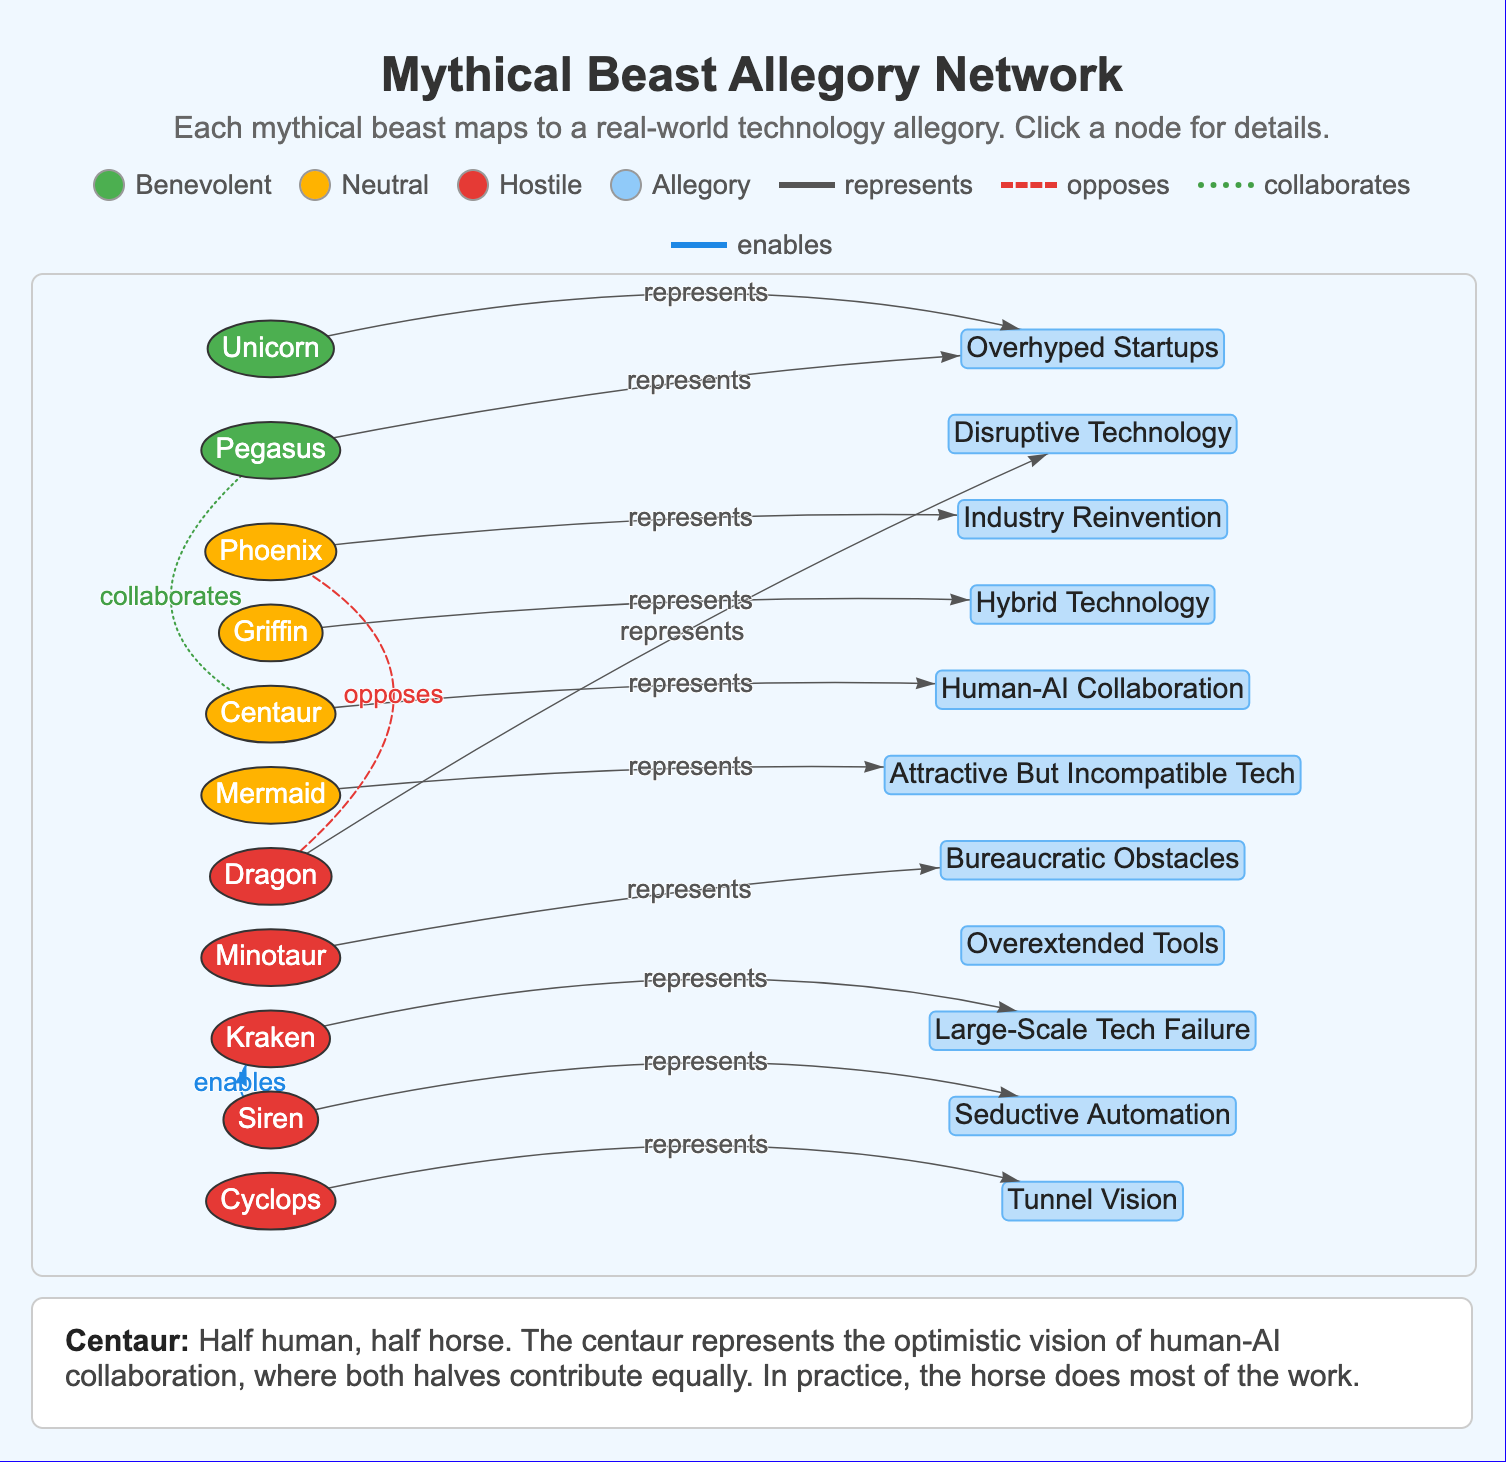
Network graph showing 11 mythical beasts connected to their real-world allegorical counterparts.
-
Beast Classification Framework
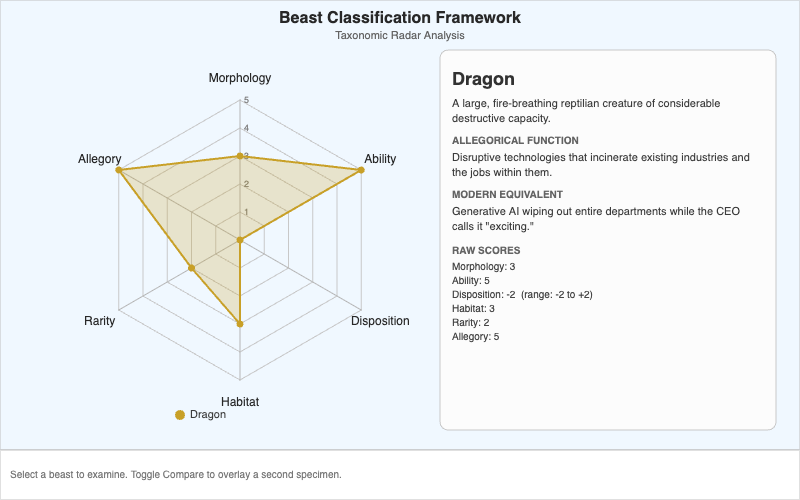
Interactive radar chart for comparing mythical beast characteristics across six dimensions.
-
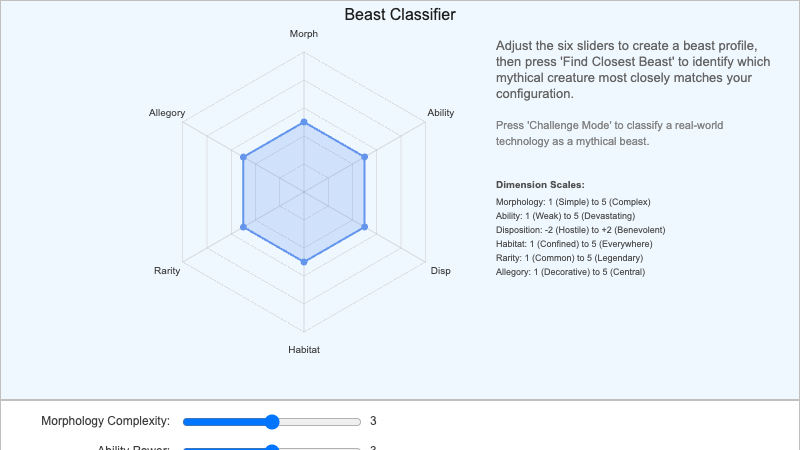
Adjust six sliders to create a beast profile and find the closest matching mythical creature.
-
Bestiary of Vaporware Field Guide
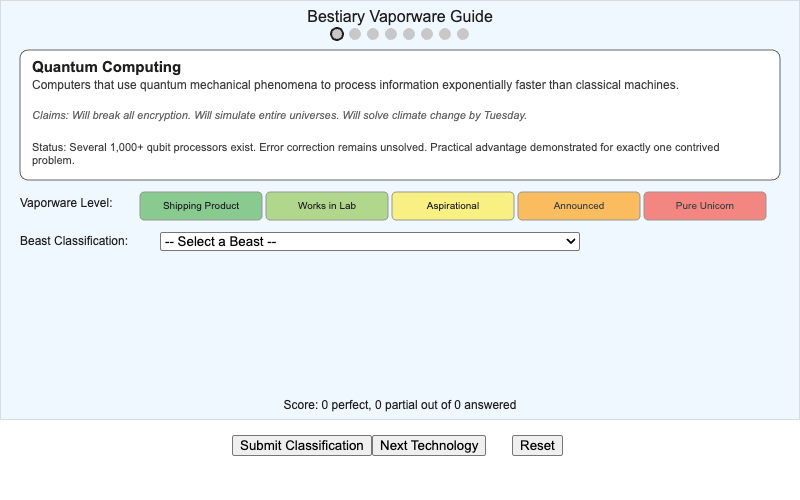
Dual-framework classification tool assigning both a mythical beast and vaporware level to technologies.
-
Blockchain Vaporware Classifier
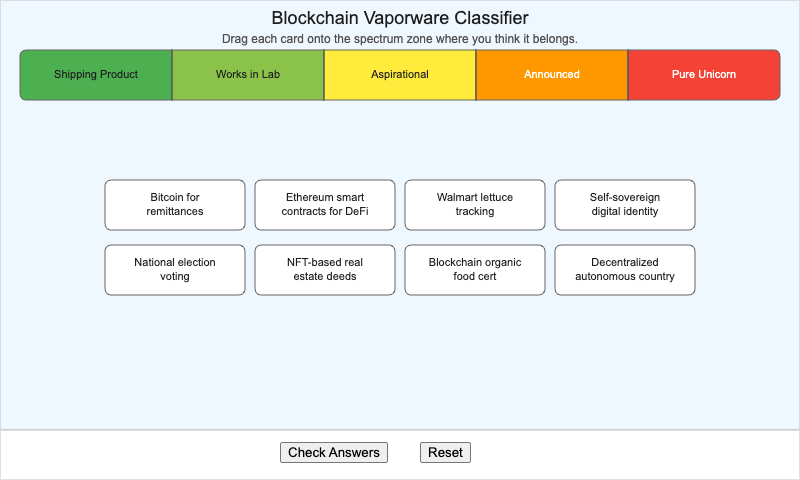
Drag blockchain applications onto a five-level vaporware spectrum from Shipping Product to Pure Unicorn.
-
Centaur Collaboration Spectrum
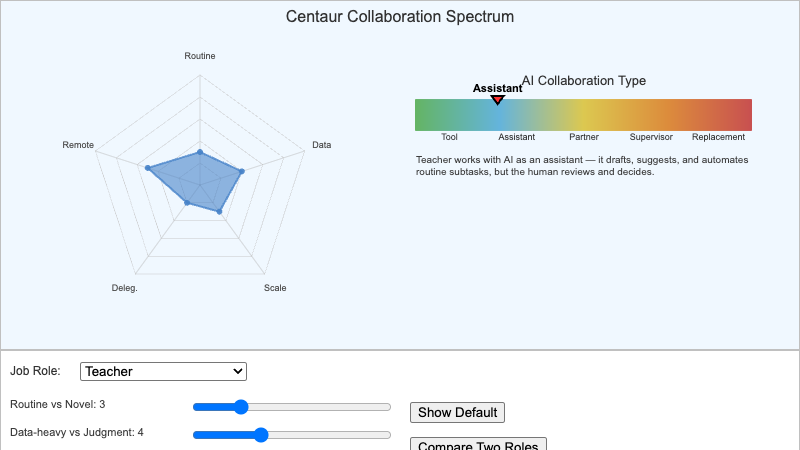
Select a job role and adjust task characteristics to see where it falls on the augmentation-to-replacement spectrum.
-
Claim Verification Decision Tree
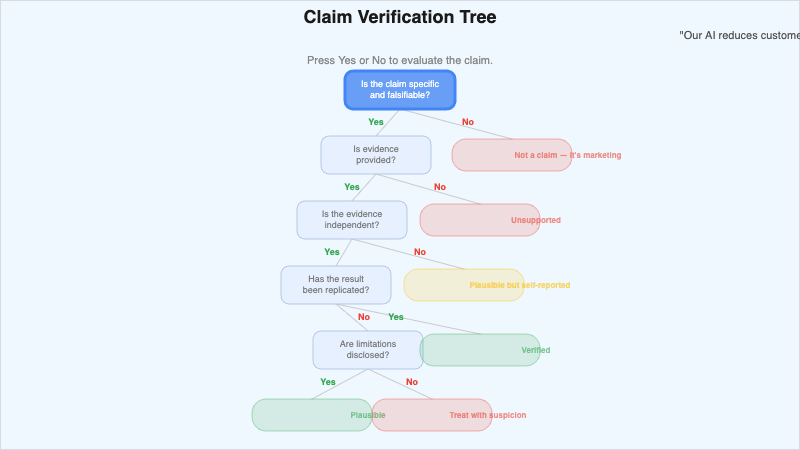
Navigate a decision tree to systematically evaluate whether an AI claim is verified, plausible, or unsupported.
-
Education Technology Adoption Lag
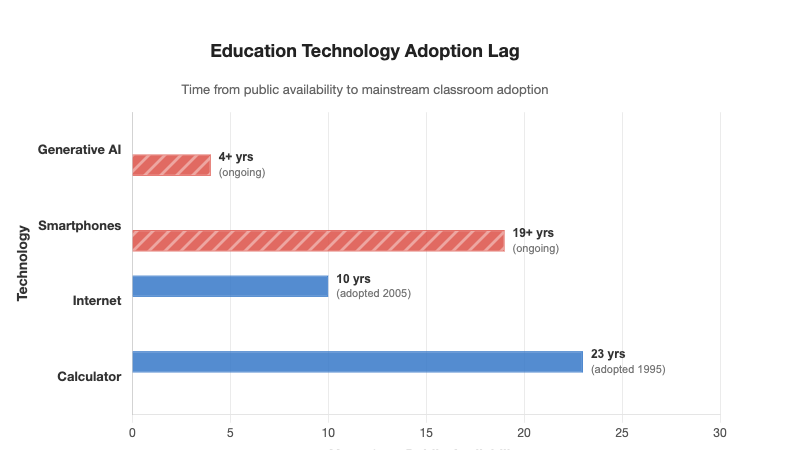
Horizontal bar chart comparing technology adoption lag in education from calculators to generative AI.
-
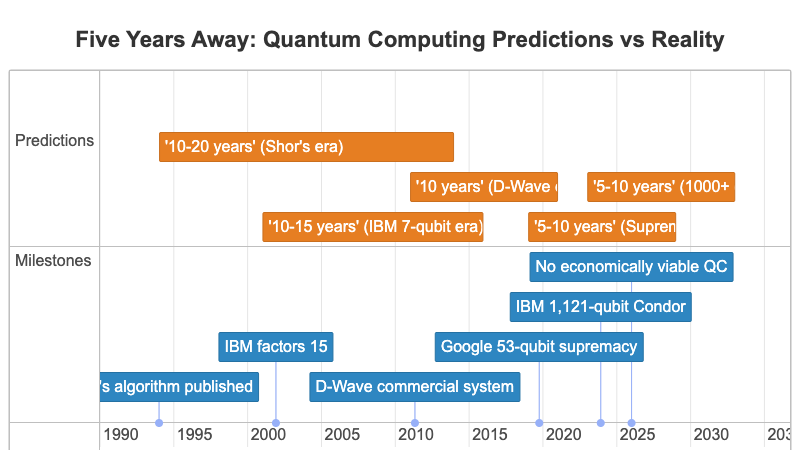
Dual-track timeline showing quantum computing predictions versus actual milestones.
-
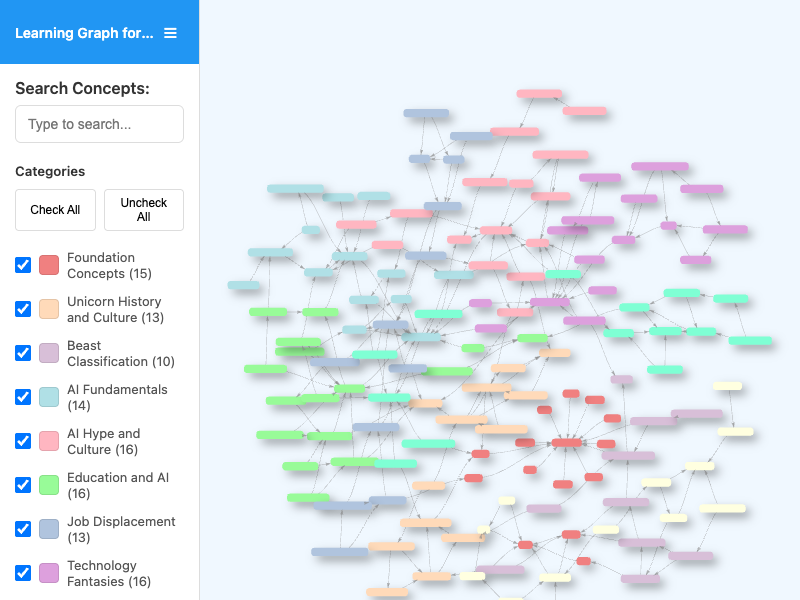
Interactive learning graph viewer showing concept dependencies and relationships.
-
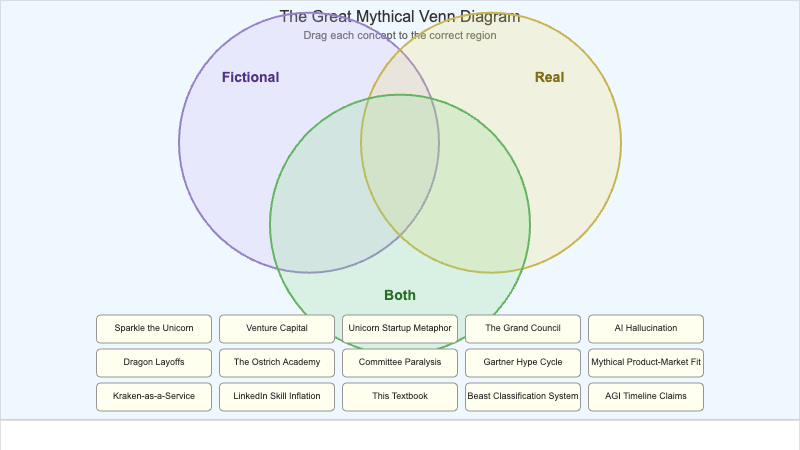
Drag 15 concept cards into the correct region of a three-circle Venn diagram: Fictional, Real, or Both.
-
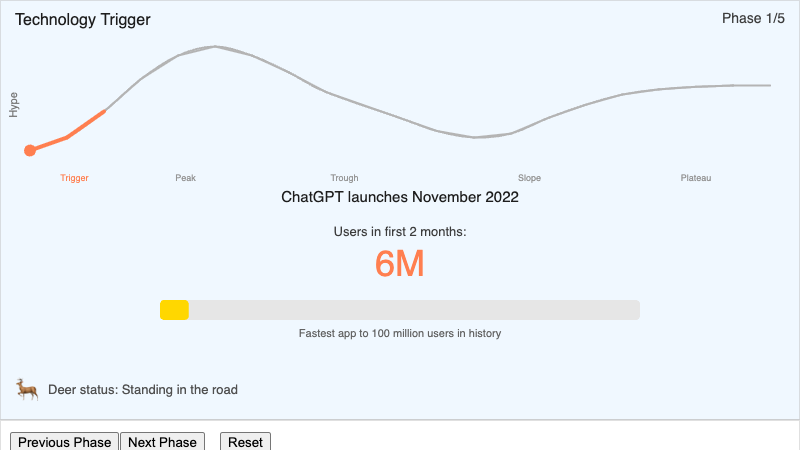
Step-through interactive showing a deer's journey through the five phases of the technology hype cycle.
-
How a Large Language Model Works
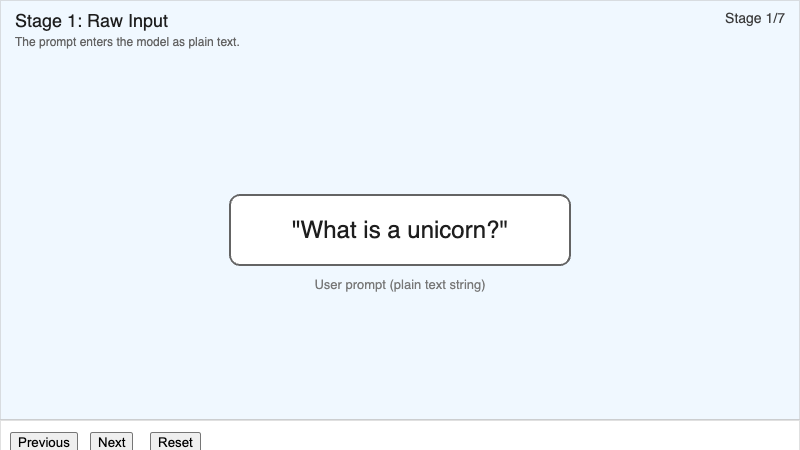
Seven-stage step-through visualization of how an LLM processes a prompt and generates text.
-
LinkedIn Skill Inflation Tracker
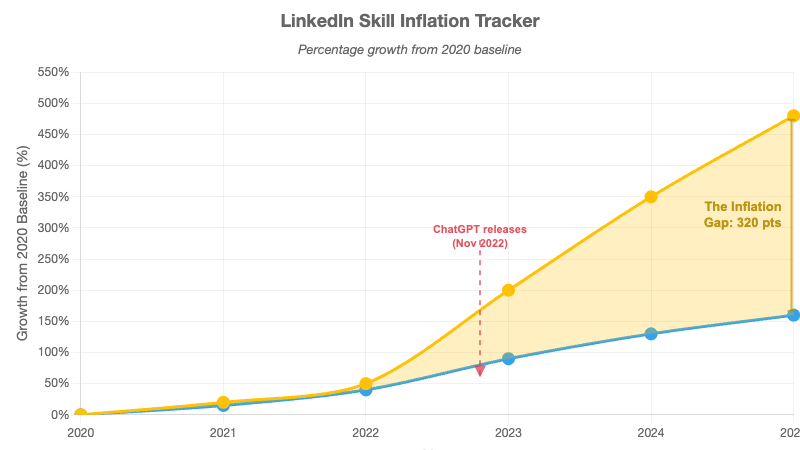
Dual-line chart comparing growth of LinkedIn AI skill claims against actual job postings requiring those skills.
-
Media Literacy Evaluation Framework
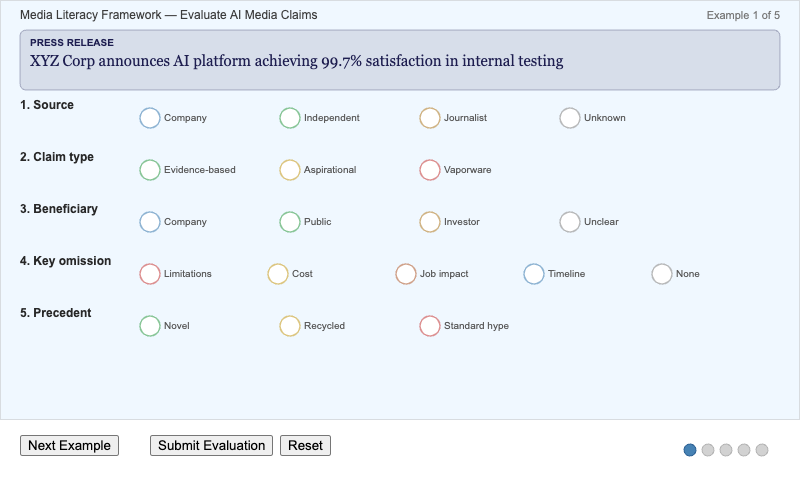
Evaluate AI media examples using a five-step checklist covering source, claims, incentives, and omissions.
-
Medieval Unicorn Belief Network
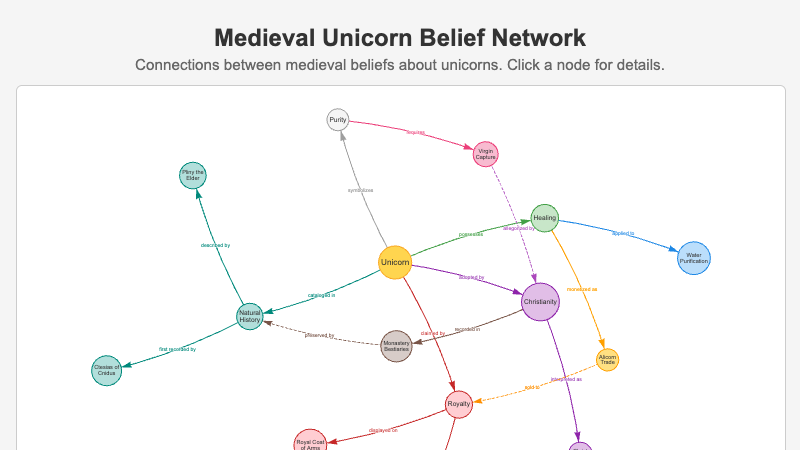
Network graph showing connections between medieval beliefs about unicorns, from purity to royal symbolism.
-
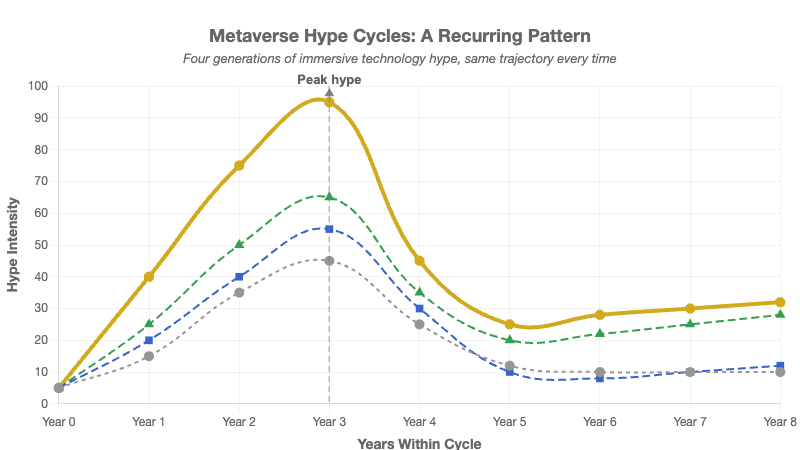
Four overlapping hype curves showing the repeating boom-bust pattern of VR and metaverse cycles.
-
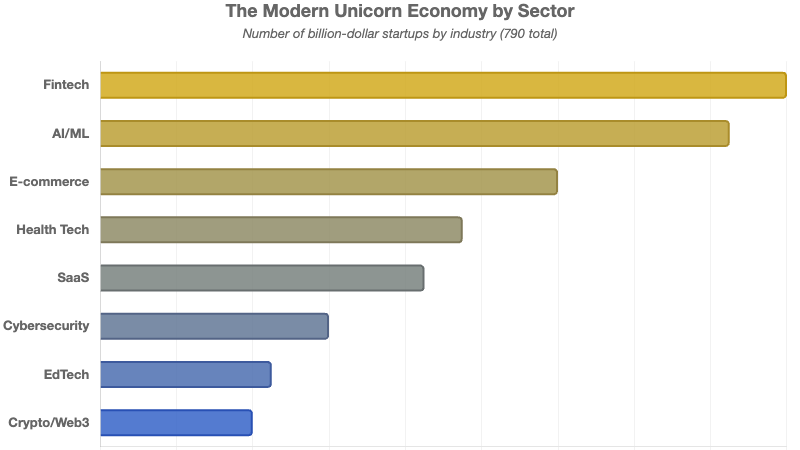
Horizontal bar chart showing the distribution of unicorn startups across industry sectors.
-
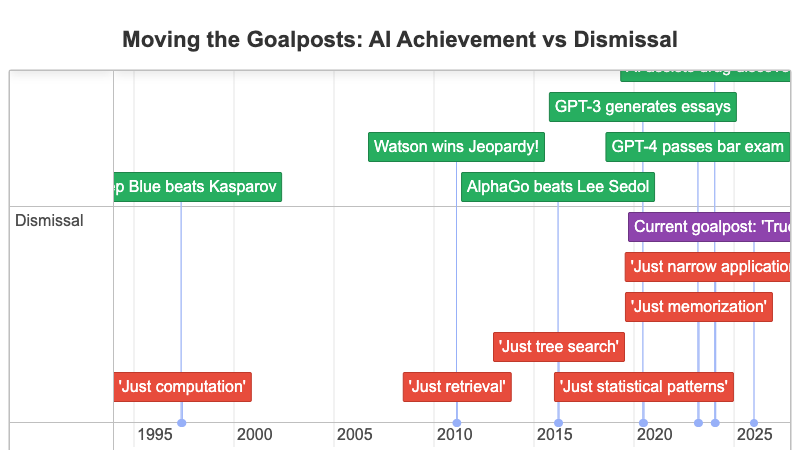
Interactive timeline pairing AI achievements with the dismissals that followed each milestone.
-
Perpetual Beta Product Lifecycle
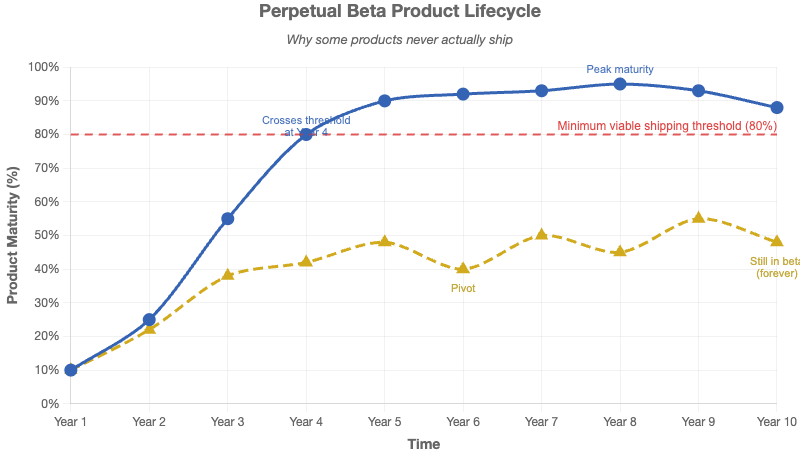
Dual-line chart comparing traditional software maturity curves against perpetual beta products.
-
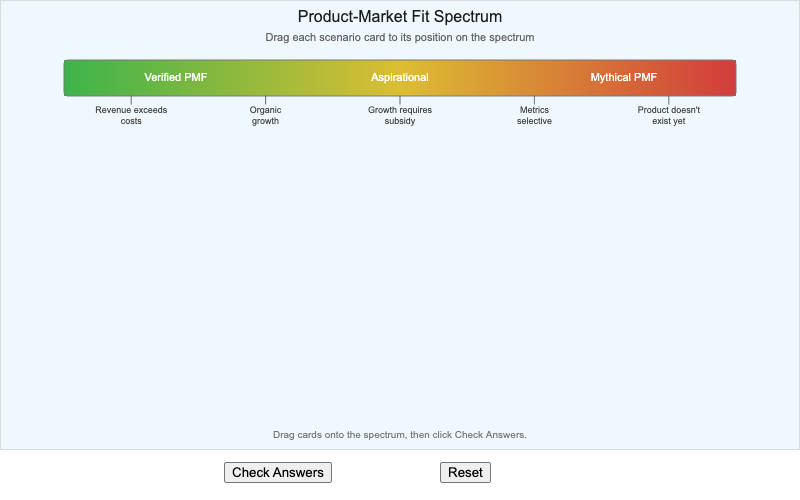
Drag startup scenario cards to their correct position on a spectrum from Verified PMF to Mythical PMF.
-
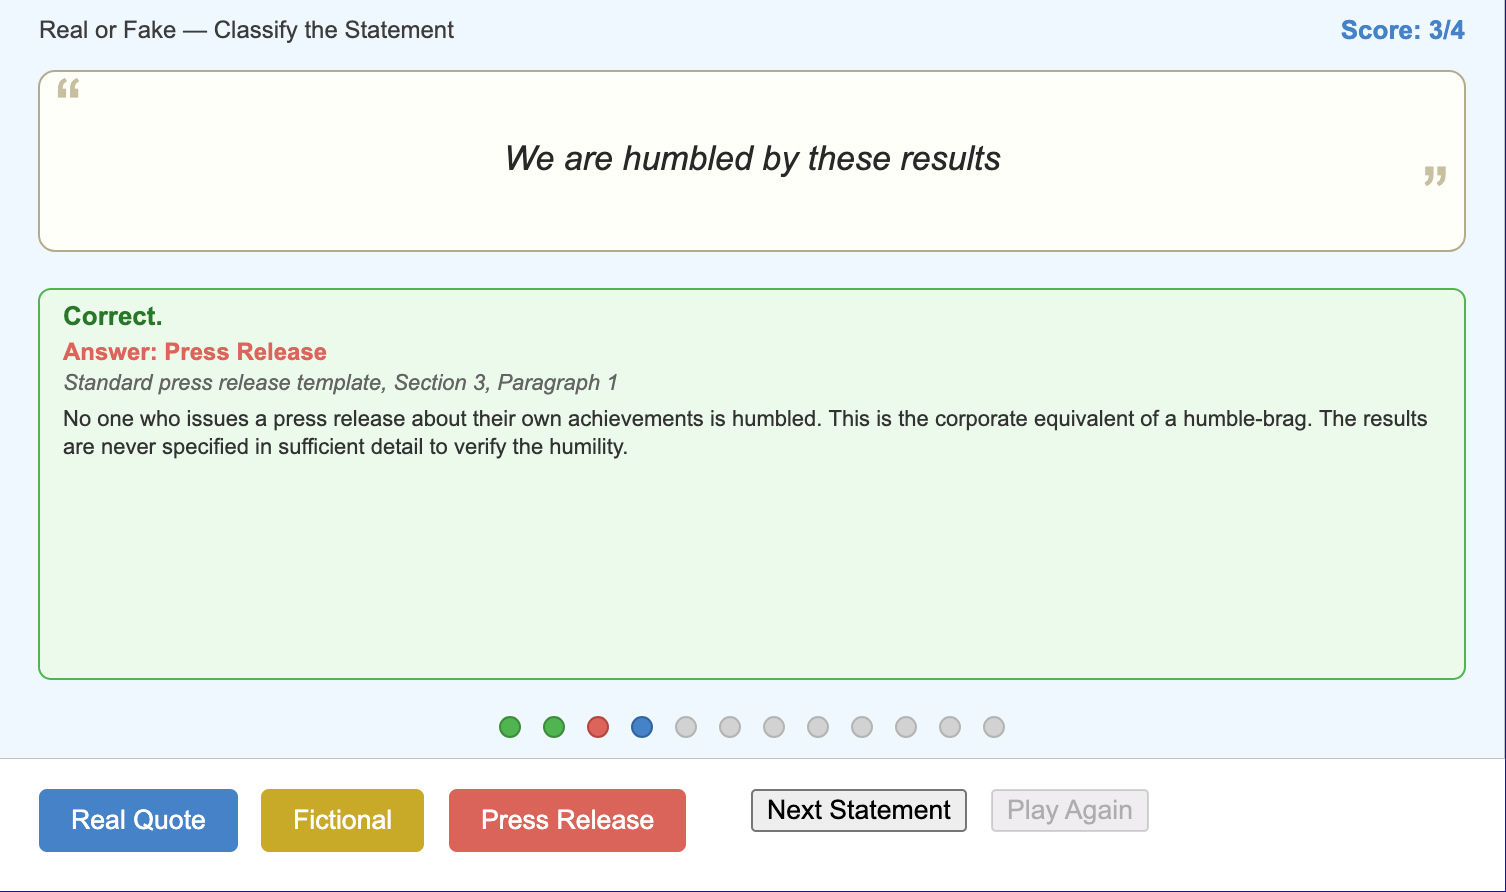
Classify 12 statements as real quotes, fictional textbook quotes, or press release language.
-
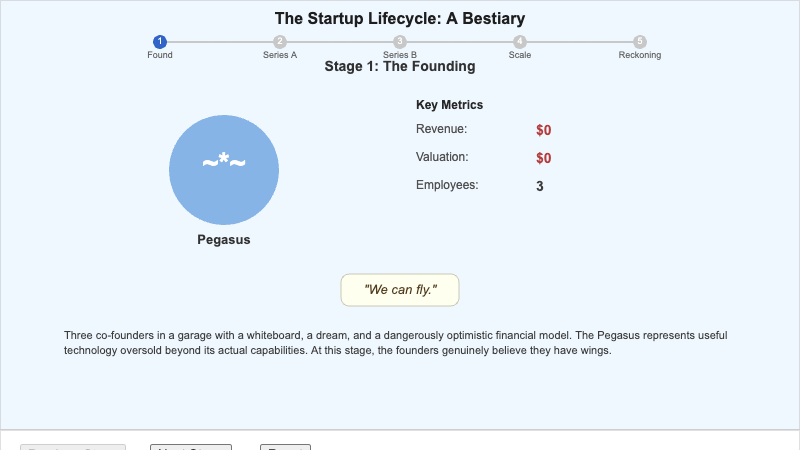
Step-through showing a startup's lifecycle mapped to different mythical beasts at each funding stage.
-
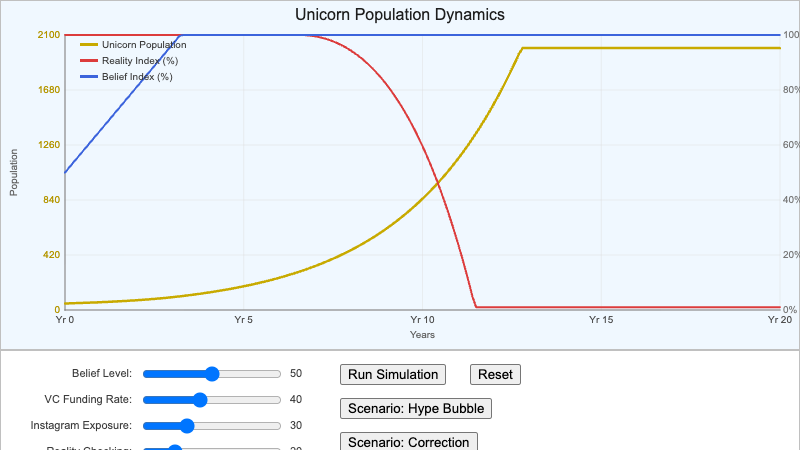
Population dynamics simulator modeling unicorn startup populations affected by belief, funding, and reality.
-
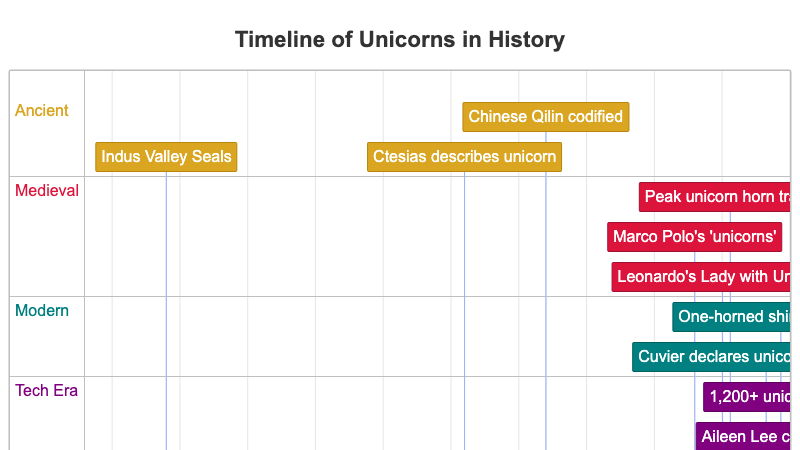
Interactive timeline tracing unicorn sightings and cultural significance from 2600 BCE to the present.
-
Unicorn Valuation Growth Chart
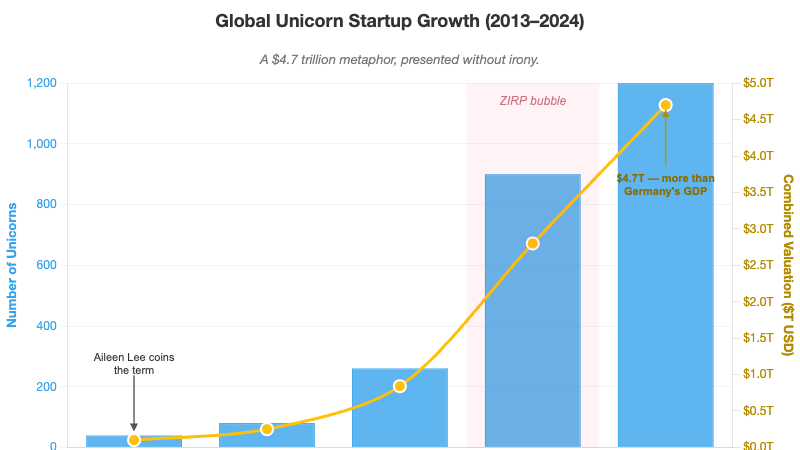
Dual-axis chart showing the exponential growth in both the number and combined valuation of unicorn startups.