Deprecated Lab — Trinket is shutting down
This lab was written for Trinket.io, which is shutting down in August 2026. The embedded trinket.io links on this page will stop working after that date.
These pages are kept for reference only. The current version of this course now runs every lab as an inline Skulpt editor right in the page — no account or install needed. Start at Chapter 1: Welcome to Python.
Sine Wave
We can also use turtle graphics to do math function plots.
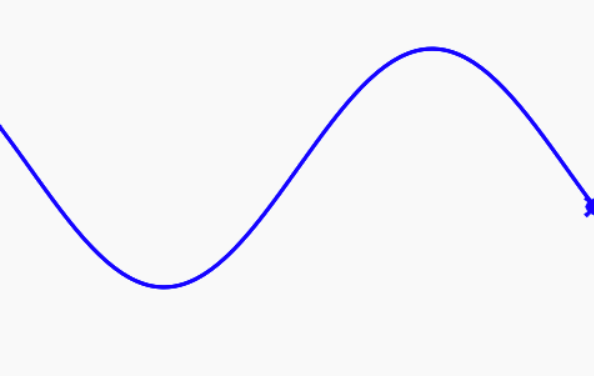
Here is an example of plotting a sine function with turtle goto() functions. We calculate the new vertical value with the following function:
1 2 | |
And we loop through about 400 values from -200 to 200. We use the radians() function to convert the numbers into a a number that will give us a single sine in the X range.
1 2 3 4 5 6 7 8 9 10 11 12 13 14 | |
Here is the output of this function: