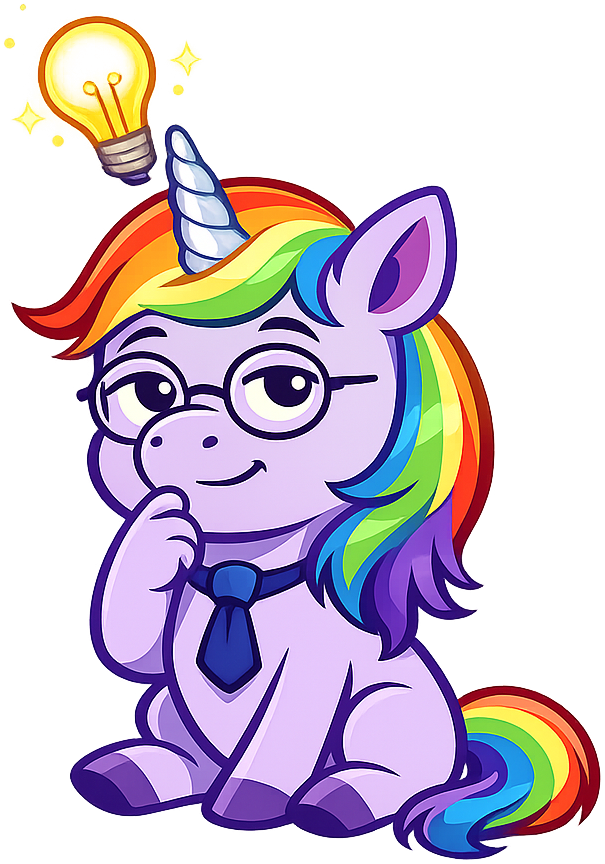
Breeding Better Unicorns with AI
Summary
This chapter speculates on how generative AI could design the perfect mythical creature, featuring interactive simulations of AI-enhanced unicorns with configurable features like rocket hooves and WiFi-enabled horns. Students explore interactive simulations, intelligent textbooks, graphic novels, and visual storytelling while using population dynamics models, timeline visualizations, and the appeal to novelty fallacy to evaluate whether better unicorns are what anyone actually needs.
Concepts Covered
This chapter covers the following 7 concepts from the learning graph:
- Intelligent Textbook
- Graphic Novel
- Visual Storytelling
- Interactive Simulation
- Population Dynamics Model
- Timeline Visualization
- Appeal to Novelty
Prerequisites
This chapter builds on concepts from:
- Chapter 1: A Brief and Totally Accurate History of Unicorns
- Chapter 6: The Ostrich Academy
- Chapter 11: Unicorn Spotting
Welcome, Colleagues
 Let me be perfectly clear. This chapter concerns the application
of generative artificial intelligence to the design and
optimization of mythical creatures. If this sounds like the
most expensive way to solve a problem that does not exist,
you have correctly identified the business model of approximately
40% of AI startups.
Let me be perfectly clear. This chapter concerns the application
of generative artificial intelligence to the design and
optimization of mythical creatures. If this sounds like the
most expensive way to solve a problem that does not exist,
you have correctly identified the business model of approximately
40% of AI startups.
The Case for Better Unicorns
The unicorn, as currently specified, has several design limitations. Its horn, while visually striking, serves no verified functional purpose. Its hide, reportedly impervious to corruption, has never been tested under laboratory conditions. Its purported ability to purify water has not survived peer review. And its hooves, while elegant, are standard equine equipment — which is to say, they are optimized for grass, not for the glass-and-steel environments where most billion-dollar valuations are assigned.
Generative AI offers the possibility of redesigning the unicorn from first principles. Rather than accepting the creature as mythology delivered it, we can apply optimization algorithms, neural network architectures, and several hundred million dollars of compute to produce a unicorn that is better suited to the modern economy. Whether the modern economy needs a better unicorn is a question this chapter will address. Whether anyone has asked for a better unicorn is a question this chapter will not address, because in the AI industry, the answer is always the same: nobody asked for it, but once it exists, everyone will want it. This is the appeal to novelty in its purest form.
The Appeal to Novelty: New Means Better, Doesn't It
The appeal to novelty is the logical fallacy that assumes something is better simply because it is newer. It is the foundational argument of technology marketing and the primary justification for product cycles in which last year's device becomes obsolete not because it stopped working but because this year's device has a slightly better camera and a differently shaped notch.
In the AI industry, the appeal to novelty operates at industrial scale:
- "Our new model outperforms the previous version" (on a benchmark that was designed for the new model)
- "This represents a paradigm shift" (from the paradigm that was itself a paradigm shift eighteen months ago)
- "Version 4.0 changes everything" (Version 3.0 also changed everything. Version 2.0 changed everything before that. The total amount of change should, by now, be approximately everything cubed)
The appeal to novelty is not limited to products. It applies to ideas, methods, and entire fields. "AI-enhanced unicorn design" is new. It is also unnecessary. But newness has its own gravitational pull, and in an economy that rewards innovation over utility, a WiFi-enabled horn is a more fundable proposition than a better horse.
Interactive Simulations: Learning by Doing
An interactive simulation is a digital model that allows users to manipulate variables and observe outcomes in real time. Unlike static diagrams or videos, interactive simulations give the learner agency — the ability to ask "what if?" and immediately see the answer.
Interactive simulations are powerful learning tools because they support multiple levels of Bloom's Taxonomy simultaneously:
| Bloom Level | How Simulations Support It |
|---|---|
| Remember | Visual elements create memorable associations |
| Understand | Cause-and-effect relationships are directly observable |
| Apply | Students manipulate parameters to solve specific problems |
| Analyze | Students compare outcomes across different configurations |
| Evaluate | Students assess which configurations produce better results |
| Create | Students design novel configurations and test them |
The unicorn feature generator described in this course's MicroSim list is an interactive simulation. It allows students to configure an AI-enhanced unicorn by selecting features (horn type, wing configuration, data processing speed, WiFi range) and observe the resulting "venture capital valuation." The simulation is absurd. The learning mechanism is real. Students who manipulate variables in a unicorn simulator are practicing the same cognitive skills as students who manipulate variables in a physics simulator. The unicorn is merely more honest about its relationship to reality.
Diagram: AI Unicorn Feature Generator
AI Unicorn Feature Generator
Type: microsim
sim-id: ai-unicorn-generator
Library: p5.js
Status: Specified
Bloom Taxonomy: Create (L6) Bloom Verb: Design, Produce Learning Objective: Students will design an AI-enhanced mythical creature by selecting and combining features, then produce an evaluation of whether the resulting creature's valuation is justified by its actual capabilities.
Purpose: Interactive unicorn configurator where students select features for an AI-enhanced unicorn and see the resulting creature profile and satirical venture capital valuation.
Visual elements: - Left panel: Feature selection controls - Horn type dropdown: "Standard spiral," "WiFi antenna," "Blockchain node," "Quantum processor," "Solar panel" - Wing configuration dropdown: "None (traditional)," "Feathered (pegasus upgrade)," "Drone rotors," "Solar wings," "Invisible (for stealth)" - Hoof type dropdown: "Standard," "Rocket-propelled," "Magnetic levitation," "Wheels," "NFT-certified" - Data processing slider: 0-100 teraflops - WiFi range slider: 0-500 meters - Sparkle level slider: 1-10 (purely aesthetic) - Center panel: Visual representation of the configured unicorn (simple stylized illustration that updates as features change — horn shape, wing type, hoof style all reflected) - Right panel: Generated "Pitch Card" showing: - Creature name (auto-generated from features, e.g., "QuantumPegasus WiFi-3000") - Feature summary - "Estimated VC Valuation" (calculated from features — more absurd features = higher valuation) - "Probability of Actually Working" (inversely proportional to valuation) - A satirical tagline generated from the feature combination
Valuation formula (satirical): - Base: $100M - WiFi horn: +$500M - Blockchain horn: +$800M - Quantum horn: +$2B - Drone rotors: +$300M - Rocket hooves: +$400M - Each teraflop: +$10M - Sparkle level multiplier: 1.0x to 2.0x - "Probability of Working" = 100% - (valuation / $50M)%, minimum 1%
Interactive controls: - 3 dropdowns (p5.js createSelect) - 3 sliders (p5.js createSlider) - Button: "Generate Pitch" — produces the pitch card with valuation - Button: "Randomize" — selects random features - Button: "Export as Pitch Deck Slide" — displays a formatted text summary
Instructional Rationale: The Create-level task of designing a creature and evaluating its valuation reinforces the satirical mapping between AI product features and mythical creature attributes established throughout the textbook. The inverse relationship between valuation and probability of working encodes the chapter's central argument in an interactive format.
Implementation: p5.js with createSelect(), createSlider(), createButton(). Visual unicorn updates with conditional drawing based on selected features. Responsive canvas using updateCanvasSize(). Canvas parented to document.querySelector('main').
The Intelligent Textbook: This Book as Specimen
An intelligent textbook is a digital textbook that incorporates interactive elements, adaptive features, and data-driven personalization to enhance the learning experience. It is distinct from a PDF or an e-book in that it does not merely present content — it responds to the learner.
Features of an intelligent textbook include:
- Interactive simulations that allow hands-on exploration of concepts
- Embedded assessments that gauge understanding in real time
- Adaptive sequencing that adjusts content based on learner performance
- Rich media integration — video, audio, animations, and data visualizations alongside text
- Progress tracking that records what the learner has completed and mastered
- Search and navigation tools that make the content accessible non-linearly
This textbook is an intelligent textbook. It contains MicroSims, interactive infographics, embedded quizzes, and a navigation structure designed for non-linear exploration. It is also, as noted repeatedly, an AI-generated textbook about AI-generated content, which makes it simultaneously a specimen and a study of the species.
The intelligent textbook is the phoenix of educational publishing. The traditional textbook — printed, static, updated every 3-5 years at a cost of $150 per student — is burning. The intelligent textbook rises from the ashes, cheaper, more interactive, and updated continuously. Whether the intelligent textbook is better than the traditional one depends on what you mean by "better." If you mean "more engaging and adaptive," the answer is probably yes. If you mean "more carefully reviewed and error-checked," the answer is probably no. The traditional textbook had a two-year editorial process. The intelligent textbook has an AI with a confidence interval.
A Critical Observation
 One observes that this textbook is an intelligent textbook
commenting on the nature of intelligent textbooks. This is
the equivalent of a unicorn writing a field guide to unicorn
spotting. The conflict of interest is acknowledged. The
analysis proceeds regardless.
One observes that this textbook is an intelligent textbook
commenting on the nature of intelligent textbooks. This is
the equivalent of a unicorn writing a field guide to unicorn
spotting. The conflict of interest is acknowledged. The
analysis proceeds regardless.
Graphic Novels and Visual Storytelling
A graphic novel is a narrative work in which the story is conveyed through sequential art — a combination of images and text arranged in panels. Graphic novels are not comic books, although the distinction is largely a matter of binding, price, and whether the person describing them is trying to sound serious.
Visual storytelling is the broader practice of using images, diagrams, sequences, and visual compositions to convey information and narrative. It encompasses graphic novels but also infographics, storyboards, data visualizations, and the carefully arranged screenshots in AI demo videos.
This textbook includes graphic novels as learning companions because visual storytelling offers capabilities that text alone does not:
- Emotional immediacy: A drawing of a deer staring at headlights conveys the freeze response more powerfully than a paragraph describing it
- Simultaneous information: A panel can show a character's expression, their environment, and a speech bubble simultaneously — three channels of information in a single frame
- Pacing control: The reader controls the pace of a graphic novel by choosing how long to look at each panel. Fast readers skim. Careful readers study the backgrounds. Both get the story
- Accessibility: Visual narratives cross language barriers and reach readers who struggle with dense text
- Engagement: Students who resist reading a chapter about institutional resistance will read a graphic novel about an ostrich principal
The graphic novels in this textbook are allegorical. The mythical beast characters say exactly what real people in real workplaces say. The humor comes from recognition: the dragon conducting layoffs is your VP of Engineering. The ostrich hiding from AI is your school principal. The mermaid updating her LinkedIn is your colleague.
Population Dynamics Models: Counting Unicorns
A population dynamics model is a mathematical simulation that tracks how a population changes over time in response to various factors. In ecology, these models track birth rates, death rates, migration, predation, and carrying capacity. In unicorn studies, they track belief rates, Instagram exposure, venture capital funding, and something called "sparkle decay."
Population dynamics models are relevant to this textbook because they illustrate two important principles:
-
Systems thinking: Populations are not static. They change in response to interconnected variables, and changing one variable has cascading effects on others. The unicorn population does not increase because more unicorns are born. It increases because more people believe in them, which increases funding, which increases sightings (or claimed sightings), which increases belief
-
Feedback loops: Positive feedback loops cause exponential growth (hype generates more hype). Negative feedback loops cause stabilization or decline (reality eventually asserts itself). The interplay between positive and negative feedback determines whether the population booms, busts, or reaches equilibrium
Diagram: Unicorn Population Dynamics Simulator
Unicorn Population Dynamics Simulator
Type: microsim
sim-id: unicorn-population-dynamics
Library: p5.js
Status: Specified
Bloom Taxonomy: Apply (L3) Bloom Verb: Demonstrate, Use Learning Objective: Students will demonstrate understanding of feedback loops and systems thinking by adjusting population model parameters and observing how changes in belief, funding, and reality-checking affect unicorn population over time.
Purpose: Interactive population dynamics simulation where students adjust sliders to see how different factors affect the unicorn (startup) population over a simulated 20-year period.
Visual elements: - Main display: Line chart showing unicorn population over time (0-20 years), updating in real time as sliders are adjusted - Y-axis: Unicorn population (0-2000) - X-axis: Years (0-20) - Three colored lines: - Gold: Unicorn population (startups valued >$1B) - Red: "Reality index" (proportion that have actual revenue) - Blue: "Belief index" (public confidence in unicorns) - Below chart: Current year values displayed numerically
Interactive controls: - Slider: "Belief Level" (0-100%, default 50%) — rate at which public believes in unicorns - Slider: "VC Funding Rate" (0-100%, default 40%) — rate of new venture capital entering the system - Slider: "Instagram Exposure" (0-100%, default 30%) — media amplification factor - Slider: "Reality Checking" (0-100%, default 20%) — rate at which due diligence is performed - Slider: "Sparkle Decay" (0-100%, default 10%) — rate at which novelty wears off - Button: "Run Simulation" — starts/restarts the simulation - Button: "Reset" — returns all sliders to defaults - Button: "Scenario: Hype Bubble" — presets sliders for bubble conditions (high belief, high funding, low reality checking) - Button: "Scenario: Correction" — presets for post-bubble correction
Model behavior: - High belief + high funding + low reality checking = exponential growth followed by crash - Moderate belief + moderate funding + moderate reality checking = sustainable growth - High reality checking = slow steady growth (boring but stable) - The "Reality Index" line eventually crosses the "Belief Index" line in all scenarios — the question is when and how dramatically
Instructional Rationale: Slider-based parameter exploration supports Apply-level learning by letting students test hypotheses about which factors drive boom-and-bust cycles. The preset scenarios provide scaffolding, while free exploration enables discovery of non-obvious dynamics (e.g., increasing reality-checking can paradoxically increase sustainable unicorn population).
Implementation: p5.js with createSlider() and createButton(). Differential equation model with Euler integration. Line chart drawn with beginShape/vertex. Responsive canvas using updateCanvasSize(). Canvas parented to document.querySelector('main').
Timeline Visualizations: When Things Happened and Why It Matters
A timeline visualization is an interactive representation of events arranged chronologically. Unlike a static timeline printed in a textbook, an interactive timeline allows users to zoom, filter, click for details, and explore connections between events.
Timeline visualizations serve several pedagogical functions:
- Contextualization: Placing events in temporal context reveals patterns invisible in isolated descriptions. The fact that "AI winter" followed "AI summer" is unremarkable in a paragraph. On a timeline, the repeating cycle is visually obvious
- Causation: Timelines can show cause-and-effect relationships by placing triggers and outcomes in sequence. The dot-com crash of 2000 and the crypto crash of 2022 appear as structural echoes when placed on the same timeline
- Scale: A timeline makes the relative speed of change visible. The gap between "calculator invented" and "calculator in schools" is 23 years. The gap between "ChatGPT released" and "ChatGPT in schools" is approximately zero, because students adopted it before schools could form a committee
The timeline of unicorns described in this course's MicroSim list traces unicorn sightings from 3000 BCE to the present day, treating ancient mythology and modern venture capital with equal scholarly gravity. The timeline is, of course, satirical. The timeline visualization technology is not.
The Breeding Program Results
After applying generative AI optimization to the unicorn design process, the following "improved" unicorn variants were produced. Each represents a genuine AI design principle applied to a fictional creature:
| Variant | AI Optimization | Feature | VC Valuation | Probability of Working |
|---|---|---|---|---|
| UniWiFi | Connectivity optimization | Horn broadcasts 5G signal | $3.2B | 4% |
| QuantaCorn | Quantum computing integration | Horn processes qubits | $8.7B | 0.3% |
| BlockSteed | Blockchain verification | Every hoofprint is an NFT | $1.9B | 12% |
| AutoCorn | Full automation | No rider needed; self-piloting | $5.4B | 2% |
| GreenHorn | Sustainability branding | Carbon-neutral sparkle | $2.1B | 18% |
| MergeaCorn | Corporate merger optimization | Two horns (for synergy) | $6.8B | 1% |
The inverse correlation between valuation and probability of working is not a coincidence. It is the mathematical expression of the unicorn-industrial complex from Chapter 3. The more fantastical the feature, the higher the valuation, because valuation is a function of imagination, not engineering. The most valuable creature in the table — the QuantaCorn — has a 0.3% chance of functioning as described. This is, by the standards of the quantum computing industry, an optimistic estimate.
A Word of Caution
 One might reasonably conclude that a creature whose primary
innovation is a horn that processes qubits would require,
at minimum, a cooling system incompatible with a mammalian
body temperature of 37 degrees Celsius. The investors did
not ask about the cooling system. They never do.
One might reasonably conclude that a creature whose primary
innovation is a horn that processes qubits would require,
at minimum, a cooling system incompatible with a mammalian
body temperature of 37 degrees Celsius. The investors did
not ask about the cooling system. They never do.
Key Takeaways
- The appeal to novelty — the assumption that newer means better — is the foundational fallacy of technology marketing and the primary driver of unnecessary innovation
- Interactive simulations are powerful learning tools because they support all six levels of Bloom's Taxonomy, from remembering to creating
- The intelligent textbook is the phoenix of educational publishing: cheaper, more interactive, and continuously updated, but with trade-offs in editorial rigor
- Graphic novels and visual storytelling provide emotional immediacy, simultaneous information channels, and accessibility that text alone cannot achieve
- Population dynamics models illustrate systems thinking and feedback loops — the interconnected variables that drive boom-and-bust cycles in both ecosystems and economies
- Timeline visualizations reveal patterns in the pace and repetition of technological change that are invisible in linear prose
- The inverse correlation between a technology's valuation and its probability of working is the central mathematical truth of the unicorn-industrial complex
Self-Assessment: Can you breed a better unicorn? Click to test yourself.
Design an AI-enhanced unicorn by selecting three features from the chapter. Calculate its estimated VC valuation using the satirical formula (more absurd = more valuable). Then estimate its probability of actually working. If the valuation exceeds $1 billion and the probability is below 5%, congratulations: you have created a unicorn in the modern sense. If the probability exceeds 50%, you have created a horse with unusual accessories, which is less fundable but more useful.
Chapter Complete
 You have applied generative AI to the optimization of a
creature that does not exist and produced variants that are
worth billions of dollars. The literature suggests this is
the most accurate simulation of the AI industry yet
constructed. Further testing is, as always, not planned.
You have applied generative AI to the optimization of a
creature that does not exist and produced variants that are
worth billions of dollars. The literature suggests this is
the most accurate simulation of the AI industry yet
constructed. Further testing is, as always, not planned.