List of MicroSims for Information Systems
Interactive Micro Simulations to help students learn information systems fundamentals — from data hierarchies and ERDs to enterprise architecture, project management, security, and AI-native operations.
-
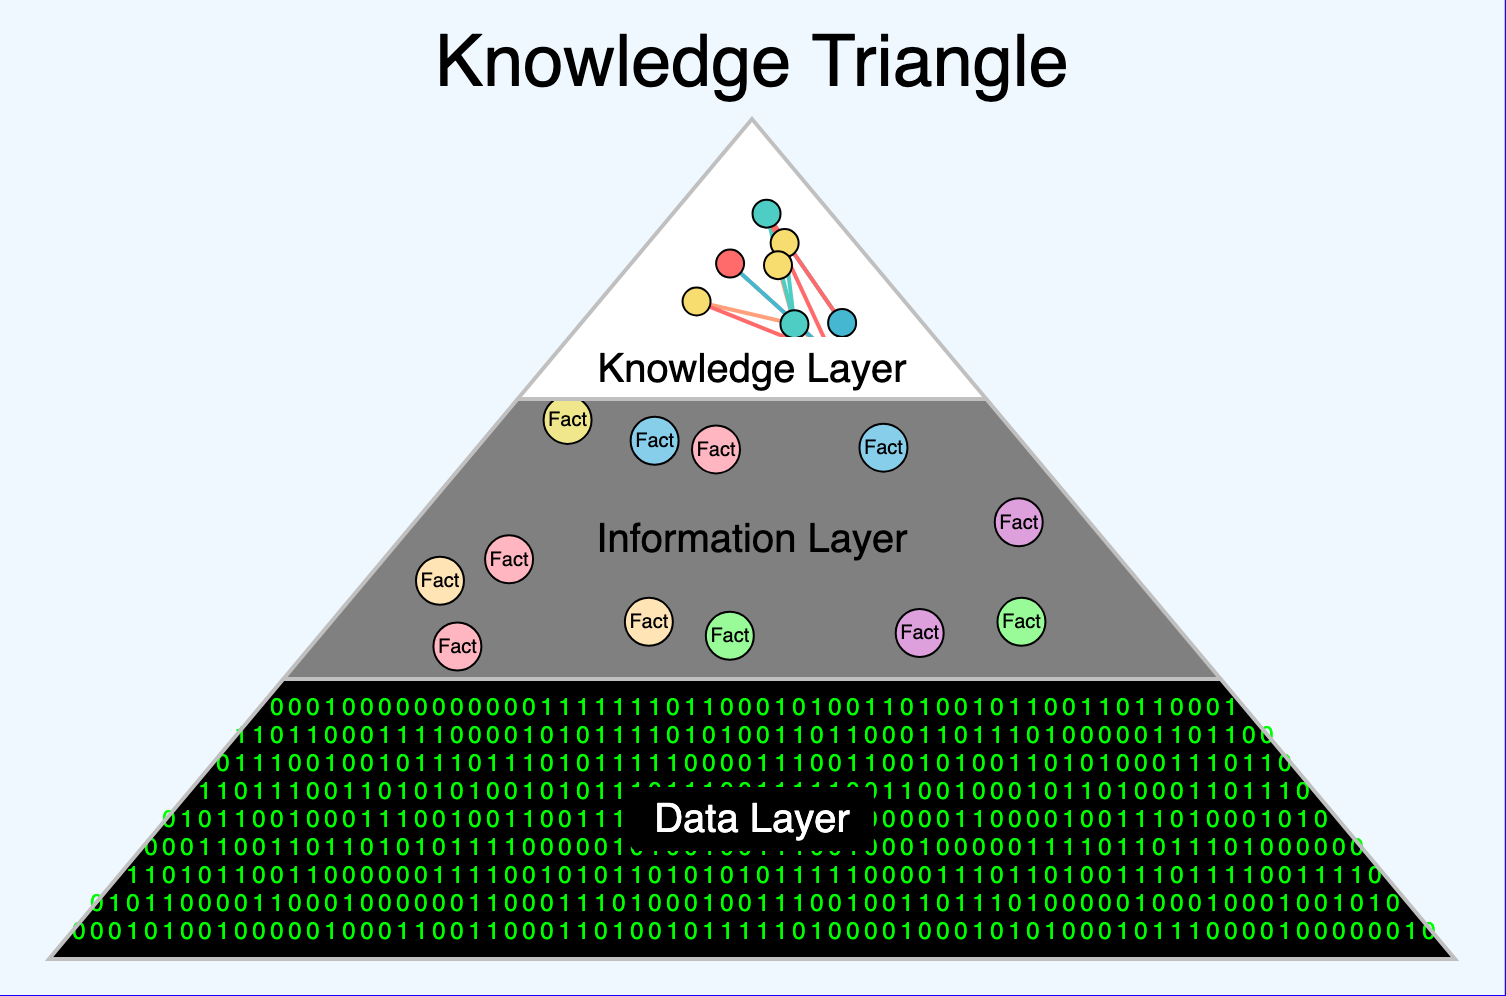
An interactive triangle with three layers for Data, Information and Knowledge.
-
A Cross-Border Data Flow Decision Tree
A Cross-Border Data Flow Decision Tree
-
A Digital Twin of a Wind Turbine
A Digital Twin of a Wind Turbine
-
A Modern CI/CD Pipeline
-
A Modern Enterprise Network — LAN, WAN, VPN, SD-WAN, Cloud
A Modern Enterprise Network — LAN, WAN, VPN, SD-WAN, Cloud
-
A Simple Feature-Branch Git Workflow
A Simple Feature-Branch Git Workflow
-
A Small Business ERD — Customer, Order, Product, Supplier
A Small Business ERD — Customer, Order, Product, Supplier
-
A Small Project's Gantt Chart with the Critical Path Highlighted
A Small Project's Gantt Chart with the Critical Path Highlighted
-
A Sprint Burndown Chart (Ideal vs Actual)
A Sprint Burndown Chart (Ideal vs Actual)
-
A Value Stream Map of an Invoice-Approval Process
A Value Stream Map of an Invoice-Approval Process
-
An Enterprise Journey Map for a Claims Process
An Enterprise Journey Map for a Claims Process
-
Anatomy of a BPMN Order-to-Cash Process
Anatomy of a BPMN Order-to-Cash Process
-
API Gateway Request Flow
-
As-Is vs To-Be — Manual, RPA, and Workflow Automation
As-Is vs To-Be — Manual, RPA, and Workflow Automation
-
Bandwidth, Latency, and Throughput at a Glance
Bandwidth, Latency, and Throughput at a Glance
-
Build vs Buy vs SaaS Decision Flow
Build vs Buy vs SaaS Decision Flow
-
Container vs. Virtual Machine Architecture
Container vs. Virtual Machine Architecture
-
DIKI Hierarchy Interactive Pyramid
An interactive four-level pyramid visualizing the Data, Information, Knowledge, and Insight hierarchy with a hospital-patient example at every layer.
-
EVM Cost and Schedule Variance Visualization
EVM Cost and Schedule Variance Visualization
-
Executive IS Roles and Reporting Relationships
Executive IS Roles and Reporting Relationships
-
graph-viewer
-
Mobile-First Responsive Breakpoints
Mobile-First Responsive Breakpoints
-
Normalization Journey from 1NF to 3NF
Normalization Journey from 1NF to 3NF
-
Porter Value Chain with IS Overlay
Porter Value Chain with IS Overlay
-
Sequence Diagram for "Place Order
Sequence Diagram for "Place Order
-
Shared Responsibility Across IaaS, PaaS, SaaS, and FaaS
Shared Responsibility Across IaaS, PaaS, SaaS, and FaaS
-
Six-Component Model of an Information System
Six-Component Model of an Information System
-
State Diagram for "Loan Application Status
State Diagram for "Loan Application Status
-
STRIDE Overlay on a Simple Web Application
STRIDE Overlay on a Simple Web Application
-
The Enterprise Systems Landscape with ERP at the Center
The Enterprise Systems Landscape with ERP at the Center
-
The ERP Implementation Timeline with Cutover
The ERP Implementation Timeline with Cutover
-
The Project Triangle (Scope, Time, Cost — and Quality in the Middle)
The Project Triangle (Scope, Time, Cost — and Quality in the Middle)
-
The Regulatory Landscape Map
-
The Scrum Sprint Cycle
-
The Six Rs Decision Tree
-
The Stakeholder Power/Interest Grid
The Stakeholder Power/Interest Grid
-
The Technical Debt Feedback Loop
The Technical Debt Feedback Loop
-
The Waterfall Model
-
Three-Tier Architecture with Request Flow
Three-Tier Architecture with Request Flow
-
TLS Handshake and the Chain of Trust
TLS Handshake and the Chain of Trust
-
Use Case Diagram for a Small Library System
Use Case Diagram for a Small Library System
-
Write Skew Under Read Committed Isolation
Write Skew Under Read Committed Isolation
-
Zero Trust Architecture vs Castle-and-Moat
Zero Trust Architecture vs Castle-and-Moat