OLED Potentiometer Example
Welcome to the Potentiometer Display
 In this lab, you will connect a potentiometer knob to your OLED display and draw a live bar chart that grows and shrinks as you turn the knob. Let's build something amazing!
In this lesson, you will use a potentiometer (a turning knob) to change what appears on an OLED display. You will use a small SSD1306 OLED with an I2C (Inter-Integrated Circuit) interface.
A potentiometer (pot for short) has three legs. The two outside legs connect to GND and to the 3.3V output. The center leg, called the tap, connects to an input that converts a continuous voltage into a digital number. This process is called analog-to-digital conversion (ADC).
Wikipedia Page on Potentiometer
Circuit Diagram

Wiring Steps
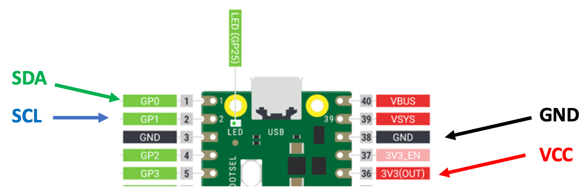
- Connect the OLED GND to Pico GND.
- Connect the OLED VCC to Pico 3.3V.
- Connect the OLED SDA to Pico GP0.
- Connect the OLED SCL to Pico GP1.
- Connect the center tap of the potentiometer to Pico GP26 (ADC0, physical pin 31).
- Connect one outer leg of the potentiometer to Pico 3.3V.
- Connect the other outer leg of the potentiometer to Pico GND.
Testing the Potentiometer
Our first task is to confirm that the potentiometer is wired correctly. GP26 is the same as ADC0 (the first analog input pin, physical pin 31 on the Pico).
1 2 3 4 5 6 7 8 | |
What each line does:
machine.ADC(26)— creates an ADC object on pin GP26. This converts the knob voltage to a number.pot.read_u16()— reads the current knob position as a 16-bit unsigned integer.utime.sleep(0.2)— waits 0.2 seconds before reading again.
Sample 16-bit Output
A 16-bit unsigned integer can hold values from 0 to 65,535. Turning the knob from one end to the other gives you numbers across this full range.
Sample readings as the knob turns from minimum to maximum:
1 2 3 4 5 6 7 8 9 10 11 12 13 14 15 16 17 | |
Key Idea
 The ADC gives you numbers from 0 to 65,535. That is 65,536 possible values (2 to the power of 16). Turning the knob all the way left gives 0. All the way right gives 65,535.
Testing the OLED
Before combining the pot and OLED, let's confirm the display works on its own.
Finding the Default I2C Pins
1 2 3 4 5 | |
Results look like this:
1 2 | |
This tells you the display is at address 60 and the default pins are GP1 (clock) and GP0 (data).
Displaying a Test Message
1 2 3 4 5 6 7 8 9 10 11 12 | |
Continuous Text Display on OLED
This program reads the pot and shows the raw number on screen every 0.2 seconds.
1 2 3 4 5 6 7 8 9 10 11 12 13 14 15 16 17 18 19 | |
What each line does:
machine.ADC(26)— creates the ADC object for the knob on GP26.POT_PIN.read_u16()— reads the raw knob value.oled.fill(0)— clears the screen so old numbers don't stay on.str(pot_value)— converts the number to a string sooled.text()can display it.oled.show()— sends the updated screen.
Monty's Tip
 Always call
 oled.fill(0) at the start of each loop. Without it, new text overlaps old text and the screen becomes a mess!
Bar Chart and Text Display of Pot Value
This program draws a live bar chart that grows as you turn the knob. It also shows the raw and scaled values as text below the chart.
1 2 3 4 5 6 7 8 9 10 11 12 13 14 15 16 17 18 19 20 21 22 23 24 25 26 27 28 29 30 31 32 33 34 35 36 37 38 39 40 41 42 43 44 45 46 47 48 49 50 51 52 53 54 | |
What each section does:
sh1106.SH1106_I2C(...)— creates the display using the SH1106 driver. Change toSSD1306_I2Cif your display uses that chip.draw_border()— draws four lines around the screen edges.valmap(raw_value, 0, 65536, 0, 127)— scales the knob value (0–65535) to screen width (0–127).oled.fill_rect(0, 1, bar_width, bar_height, 1)— draws a filled rectangle whose width matches the knob position.oled.text('raw:', 0, half_height + 5, 1)— draws the label "raw:" in the bottom half of the screen.
Watch Out!
 If you use the wrong display driver (ssd1306 vs sh1106), the screen may show garbage or nothing at all. Check the chip name on the back of your OLED module.
Gif of OLED
Gif of small .96" OLED:
Gif of larger 2.42" OLED:
Great Work!
 You connected a physical knob to the display and showed live data as a bar chart! Next, you will use two potentiometers to draw like an Etch-A-Sketch.