Get the Weather Forecast
Welcome to Weather Data!
 In this lab your Pico W will fetch a real weather forecast from the internet! You will see temperatures for the next five days.
In this lab you will use a free web service called Open Weather Map. You will send a request to the service and it will reply with predicted temperatures and weather conditions. The service gives forecasts for every three hours over the next 40 time periods — that is five days of weather data!
How to Use the Open Weather Map API
An Application Programming Interface (API) is a way for your program to talk to a web service. The Open Weather Map API gives you weather data in exchange for a key (like a password). You must register on their website to get your own API key.
Once you have your key, add it to your secrets.py file:
1 2 3 4 | |
Monty's Tip
 Always store API keys in
 secrets.py and add that file to .gitignore. Never share your API key publicly — someone else could use it and use up your free quota.
You then build the web address (URL) for your city. Each city has a number called a GeoNames ID. The city of Minneapolis, Minnesota has the ID 5037649. You can find your city's ID at GeoNames.
1 2 3 | |
You can also use the curl command on a computer to test the URL before running it on the Pico:
1 2 3 4 | |
Parsing the JSON Response
The service sends back a JavaScript Object Notation (JSON) file. JSON is a way to organize data using labels and values. Think of it like a nested set of labeled boxes.
Here is part of what the JSON looks like:
1 2 3 4 5 6 7 8 9 10 11 12 13 14 15 16 17 18 19 20 21 22 23 24 25 26 27 28 29 30 31 32 33 34 35 36 37 38 39 40 41 | |
The main data is in the list section. There are 40 entries — one for every three-hour period. Each entry has temperature, humidity, wind, and weather description.
To get the temperature for each time period you loop through the list:
1 2 3 4 | |
Key Idea
 JSON path statements look like addresses inside a dictionary.
 weather['list'][0]['main']['temp'] means: inside weather, go into list, get the first item (index 0), then go into main, and read the value called temp.
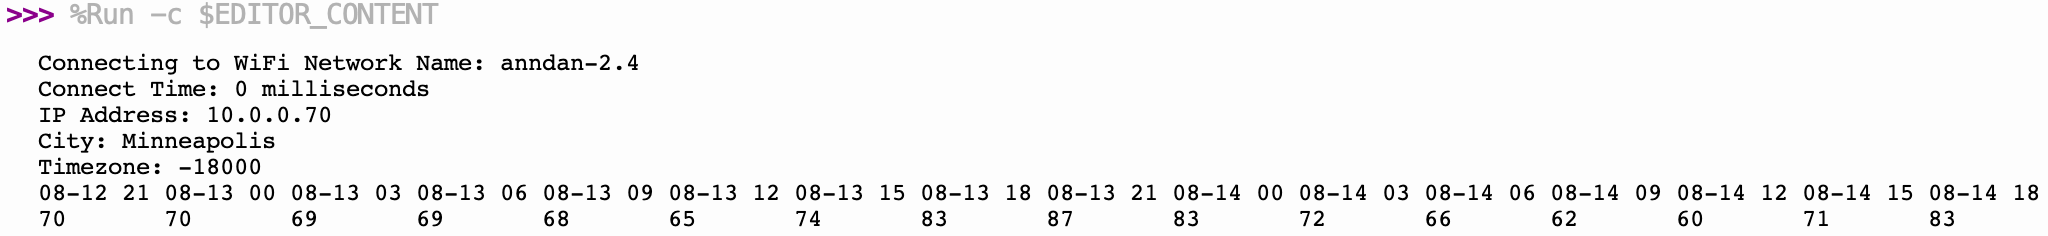
Sample Output
Here is the output shown in the Thonny shell for the first 16 temperature values:
Plotting the Forecast with Thonny Plot
Thonny has a built-in Plotter that can draw live graphs from the console output. If you print values in the right format, Thonny will graph them for you automatically.
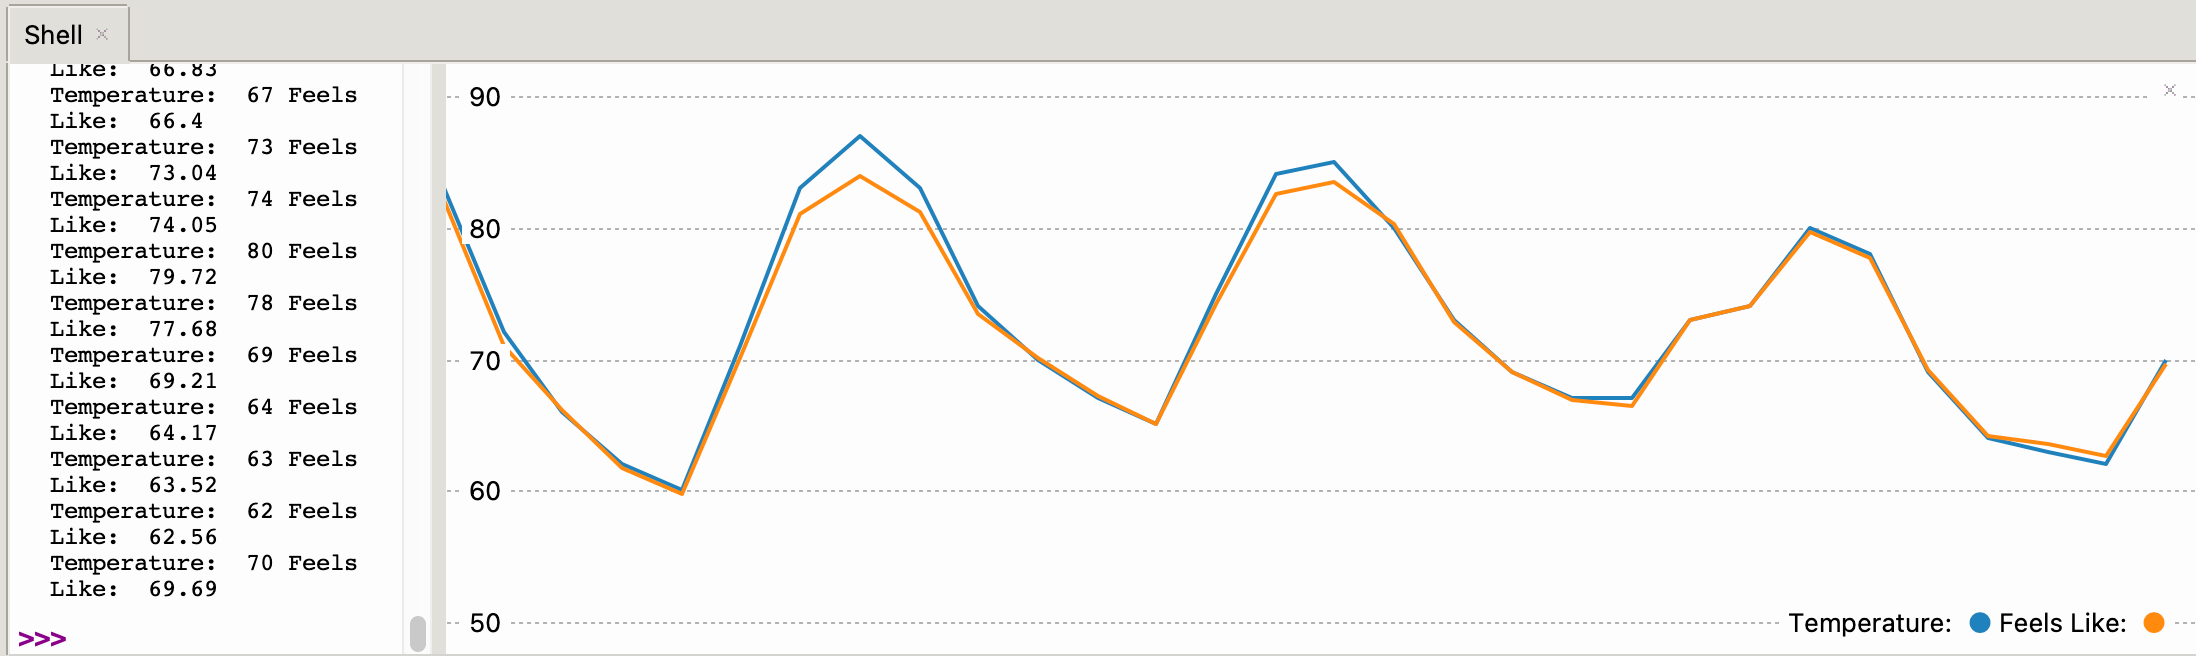
Each printed line needs:
- A label string
- A colon
- The numeric value
Here is what that format looks like:
1 2 3 | |
Sample Code
1 2 3 4 5 6 7 8 9 10 11 12 13 14 15 16 17 18 19 20 21 22 23 24 25 26 27 28 29 30 31 32 33 34 35 36 37 38 39 40 41 42 43 44 | |
What each line does:
urequests.get(url).json()— fetches the URL and converts the JSON text to a Python dictionaryweather['city']['name']— reads the city name from the JSONweather['list'][i]['dt_txt'][5:13]— reads the date/time string and slices out just the month-day and hourround(weather['list'][i]['main']['temp'])— reads the temperature and rounds to the nearest degree
Displaying Predicted Temperatures in a Thonny Plot
Thonny has a Plot object that draws a live graph from your output. Print one temperature per line and Thonny will graph them automatically:
1 2 3 | |
Excellent Work!
 Your Pico W just fetched a five-day weather forecast! In the next lab you will display this forecast on an OLED screen attached to your Pico W.