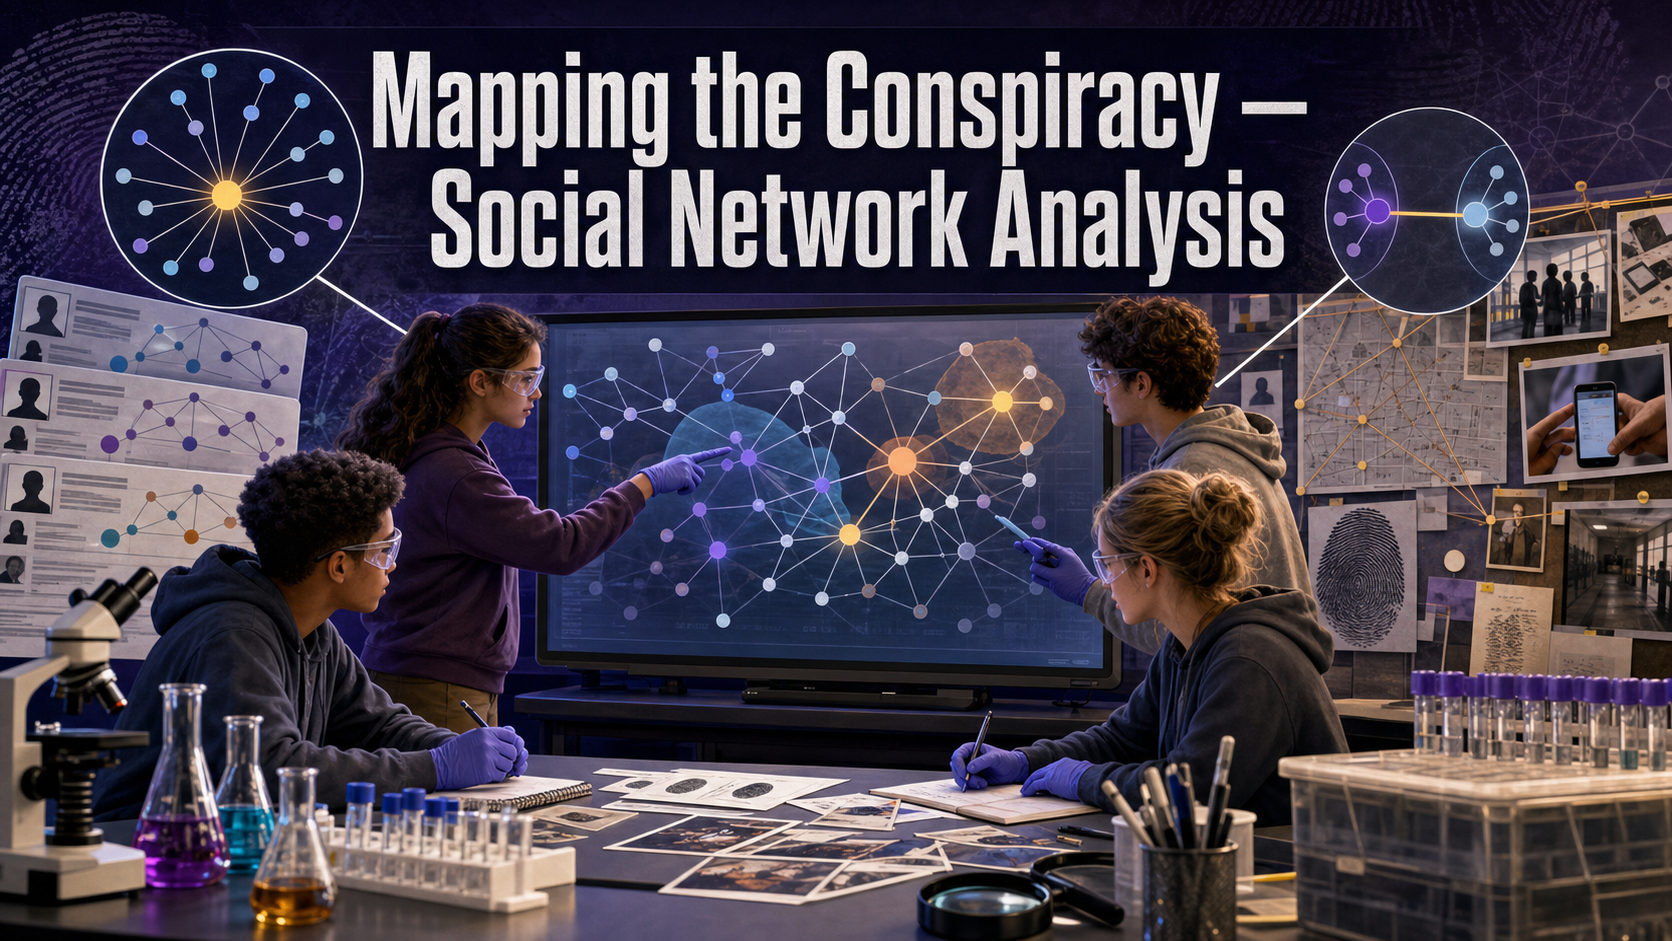
Mapping the Conspiracy — Social Network Analysis
Welcome, Investigators!

You don't always need to read the messages to know who's in charge. Sometimes the shape of who-talks-to-whom gives away the whole operation — the person at the center, the quiet broker linking two crews. Today you'll draw that shape and let the network confess. Follow the evidence!
The Case
Investigators have seized call logs and mapped the social-media connections of a suspected smuggling crew. Nobody wrote "I'm the boss" anywhere. But the pattern of connections tells a story on its own: someone sits at the hub of the whole group, and one person quietly bridges two otherwise-separate cells.
Your job: turn the raw connection list into a network graph, then use two mathematical measures — degree centrality and betweenness centrality — to name the likely ringleader and the key broker. You'll show that in a criminal network, who is connected to whom can reveal roles even when the content of the messages is unknown.
Learning Objectives
By the end of this investigation you will be able to:
- Construct a social network graph from a list of communication links.
- Calculate degree centrality to find the most-connected actors.
- Apply betweenness centrality to find the broker linking two groups.
- Evaluate how network structure alone can reveal roles in a conspiracy.
Quick Facts
| Lab type | 💻 Virtual |
| Group size | 2–3 investigators |
| Time | 45–55 minutes |
| Cost | $0 — computer-based |
| Ties to | Ch 18 — Social Network Analysis, Social Media Forensics, OSINT / Open-Source Intelligence · Ch 17 — Call Detail Records |
Materials
Per group:
- None — a laptop and a browser.
- The instructor's provided edge-list evidence card (the seized connections) and the list of suspect names.
- Assumes access to one computer per group.
Structure Is a Lead, Not a Verdict

- A high-centrality node is a person of interest, not a proven ringleader. Being well-connected is a reason to investigate, not evidence of a crime.
- Build graphs only from the provided sample data. Mapping real people's social connections without legal authority is surveillance, not schoolwork.
- Connection data shows that people communicated, not what about. Keep your claims to what the structure actually supports.
Background: Reading a Network's Shape
A social network is just a set of nodes (people) joined by edges (connections — a call, a text, a follow). Draw it out and the crew's organization starts to show. Two measures of centrality do most of the analytical work.
Degree centrality counts how many direct connections a node has. The person with the most edges is the network's hub — often a leader or a highly active coordinator. It's the simplest measure: just count the lines touching each node.
Betweenness centrality is subtler and often more revealing. It measures how often a node sits on the shortest path between other pairs of nodes. A person with high betweenness may not have the most connections, but they act as a broker — the bridge that information (and orders, and money) must cross to get from one cell to another. Remove that broker and the network can split in two. That's why investigators watch brokers closely: they're the network's chokepoints. This kind of open-source structural analysis is a core OSINT technique.
Explore: Social Network Analysis
Social Network Analysis Interactive MicroSim
Type: microsim
sim-id: social-network-analysis
Library: vis-network
Status: Specified
Learning Objective: Build a network graph from an edge list and use degree and betweenness centrality to identify key actors (Bloom Level 4 — Analyze).
Enter the seized connections and watch the graph assemble. Toggle the centrality view: the largest, brightest node is the highest-degree hub, and the node the sim flags as the bridge is your broker. Confirm both against your own counts.
Procedure
Part 1 — Build the network.
- Open the network MicroSim. From the edge-list evidence card, enter each connection (person A ↔ person B) as an edge.
- Once every edge is in, arrange the graph so you can see the overall shape. Look for a dense cluster and any obvious bridges between clusters.
- Confirm you've entered every listed connection — a missing edge can hide a broker.
Part 2 — Find the ringleader (degree).
- For each person, count their direct connections (their degree). Record the counts in your data table.
- The highest-degree node is your candidate ringleader / hub. Note the top two in case they're close.
Part 3 — Find the broker (betweenness).
- Identify the two cells (clusters) in the graph.
- Find the node (or nodes) that the shortest paths between the two cells must pass through — the bridge. That's your candidate broker.
- Test it: mentally remove the broker. Do the two cells fall apart? If so, you've confirmed the chokepoint.
Data Collection
| Person | Degree (direct links) | On the bridge between cells? | Candidate role |
|---|---|---|---|
Analysis Questions
- Who has the highest degree, and why does that make them a candidate ringleader? Cite their connection count.
- Who is the broker linking the two cells? Explain how you know the shortest paths run through them.
- The ringleader and the broker might be different people. Explain, in your own words, why the most-connected person isn't always the most strategically important.
- What happens to the network if the broker is arrested? What happens if the hub is arrested instead? Which removal does more damage?
- Network structure shows connections, not content. Name one thing this analysis cannot tell you, and one piece of evidence you'd seek to confirm a role.
Deliverable
Turn in a Network Analysis Brief: your graph (a screenshot or sketch with every node and edge), the degree table, and a short paragraph naming your candidate ringleader and broker — each justified by the specific centrality evidence — and noting what further evidence would be needed to confirm the roles.
What Does the Data Tell Us?

Here's the insight that makes network analysis powerful: you can spot the person who matters most without reading a single message. Structure reveals roles. But "central" means "worth investigating," never "guilty" — the graph hands you a lead, and the rest of the case has to earn the conviction.
Extension Challenge: The Resilient Network
Smart criminal networks are built to survive an arrest. Research the idea of a decentralized or cell-structured network and redesign your graph so that removing any single node does not split the group. What did you have to add? What does your redesign cost the network in speed or coordination? Write a short comparison of the centralized vs. resilient structure.
Teacher Notes
Setup, timing, and grading (click to expand)
- Prep: Author an edge list of ~8–12 people forming two clusters joined by one bridge node, with a clearly highest-degree hub inside one cluster. Make the hub and the bridge different people — that separation is the whole lesson. Hand out names only (no roles).
- The two-answer design: Because the ringleader (degree) and broker (betweenness) are different nodes, groups that only count connections will miss the broker — exactly the mistake to surface in discussion.
- Differentiation: For a shorter run, give the graph pre-drawn and have groups only compute centrality. For a challenge, add a decoy high-degree node that is not a bridge, forcing students to distinguish the two measures.
- Assessment focus: Reward correct identification of both the hub and the broker with the right measure cited for each, and the "lead not verdict" caveat.
Case Closed — For Now

You found the boss and the bridge without cracking a single message — the network drew its own org chart. That's the quiet power of structure: sometimes the map of connections says more than the conversations ever could. Follow the evidence!