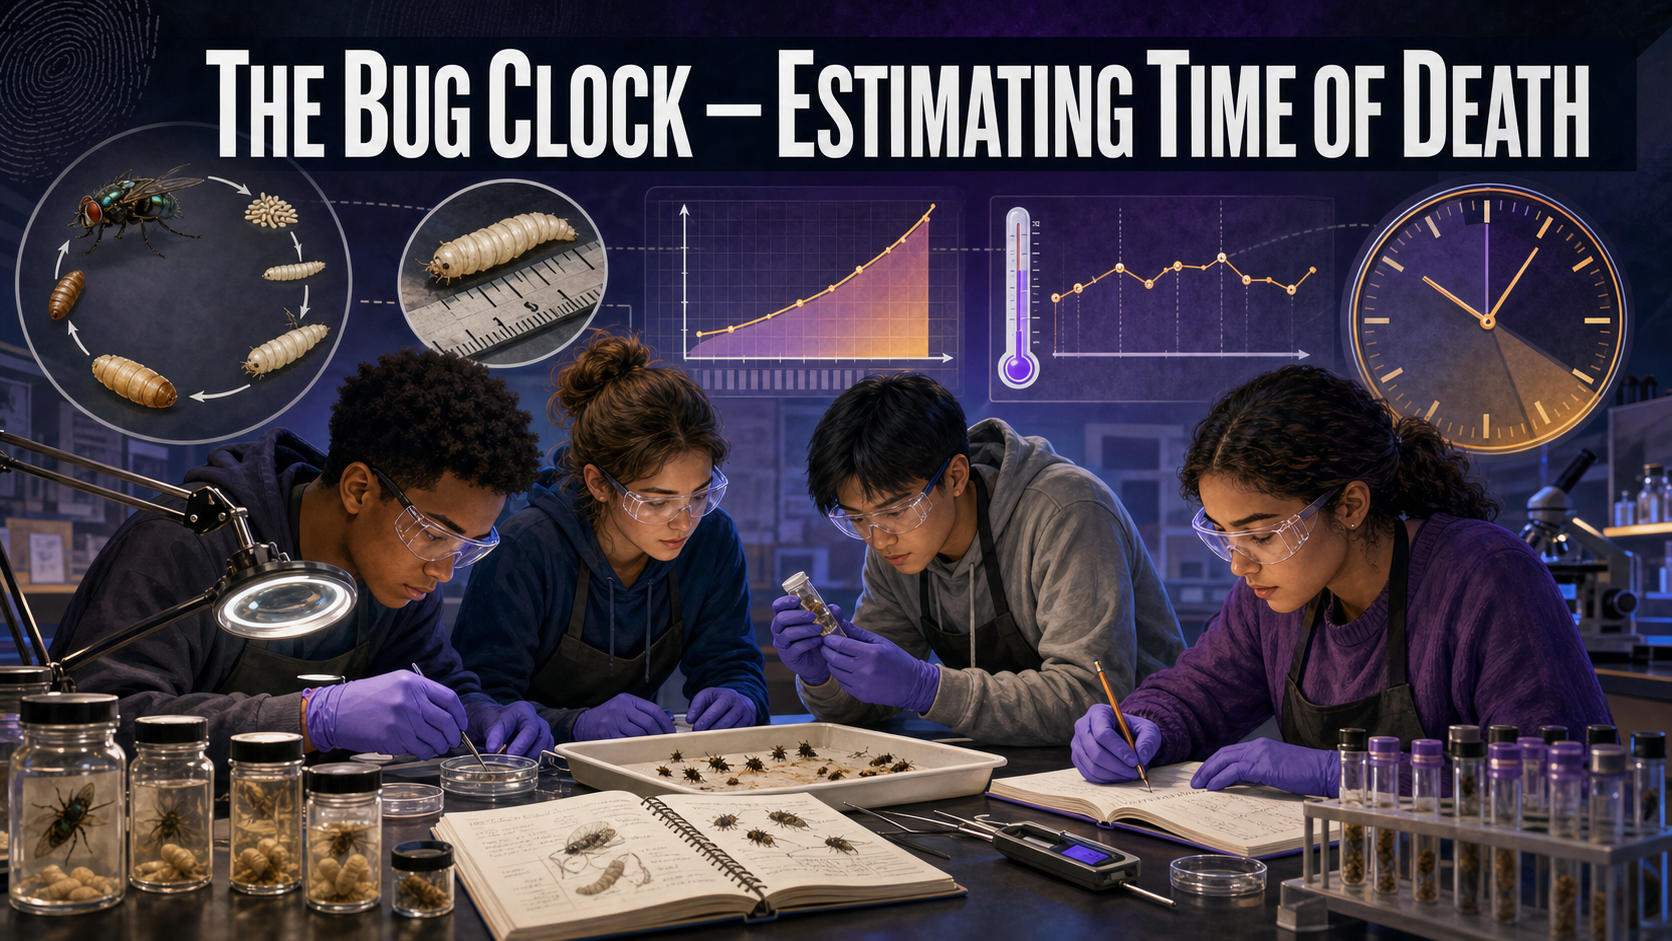
The Bug Clock — Estimating Time of Death
Welcome, Investigators!

A pathologist can read the last few hours after death — but after a couple of days the body stops telling time. So who takes over the clock? The insects. Blowflies arrive within minutes, lay eggs, and their growing larvae keep perfect time as long as you know the temperature. Today you'll read that bug clock and estimate when someone died. Follow the evidence!
The Case
A body is discovered in a wooded lot on a warm week in June. The medical examiner can't narrow the time of death from the body alone — it's been too long. But the maggots don't lie. On the remains, the largest blowfly larvae measure 9 mm long. A weather station near the scene logged the temperature every hour since the body was found.
Your job: use the larval length, a development chart, and the temperature log to back-calculate how long those insects have been growing — which gives the medical examiner a science-based minimum post-mortem interval (PMI): the shortest time that could have passed since death.
Learning Objectives
By the end of this investigation you will be able to:
- Describe the blowfly life cycle and how larval instar stages track time.
- Measure larval length and read a development chart to find the required thermal energy.
- Calculate accumulated degree-hours (ADH) from an hourly temperature log and a base temperature.
- Evaluate a minimum-PMI estimate by identifying the assumptions that could make the true interval longer.
Quick Facts
| Lab type | 🔀 Combination (math core + optional multi-day rearing) |
| Group size | 2–3 investigators |
| Time | 40–50 minutes (core math); 1–2 weeks for optional rearing |
| Cost | ≈ $10 per group (near-zero for math; optional rearing) |
| Ties to | Ch 12 — Larval Instar Stages, Accumulated Degree Hours, Minimum Post-Mortem Interval, Blowfly Lifecycle, Insect Succession |
Materials
Per group (≈ $10, mostly optional):
- Printed temperature log (hourly readings from the scene)
- Printed blowfly development chart (larval length → required ADH)
- Metric ruler with millimeter markings
- Calculator
- Optional physical extension: mealworms from a pet store, a ventilated container, and rolled oats — observed over 1–2 weeks
- Optional succession demo: a small piece of chicken liver sealed in mesh
- Shared: one classroom laptop or tablet for the MicroSim
Safety & Handling Rules

- The core lab is paper and math — no biological hazard at all.
- If you run the optional succession demo, use chicken liver only, seal it in fine mesh, keep it outdoors, and dispose of it responsibly when finished. Never bring decomposing meat indoors.
- Wash hands after handling mealworms or their bedding. They're harmless, but good lab habits are good lab habits.
Background: The Insects That Keep Time
When a body is exposed, blowflies are usually the first witnesses on the scene — they can arrive within minutes. They lay eggs, the eggs hatch into larvae (maggots), and those larvae eat and grow through predictable instar stages before becoming pupae and finally adult flies. Because each stage takes a known amount of development to reach, the size of the largest larvae tells you how long the insects — and therefore, at minimum, the body — have been there.
There's one catch: insects are cold-blooded, so they grow faster when it's warm and slower when it's cold. You can't just count hours on a clock. Instead you count degree-hours — a measure that combines time and temperature. For each hour, you subtract a species-specific base temperature (the temperature below which the insect stops developing) from the actual temperature, and add up the result. That running total is the Accumulated Degree Hours (ADH). When the ADH reaches the amount a 9 mm larva needs, you've found how far back in time the clock started.
This gives a minimum PMI, not an exact one — flies need a body to find first, and they don't always arrive instantly. Real forensic entomologists treat their estimate as "at least this long," and so will you.
Explore: The ADH Minimum-PMI Calculator
ADH Minimum-PMI Calculator Interactive MicroSim
Type: microsim
sim-id: adh-mpmi-calculator
Library: p5.js
Status: Implemented
Learning Objective: Calculate a minimum post-mortem interval by accumulating degree-hours backward from discovery until cumulative ADH meets the threshold for a chosen blowfly species and larval stage (Bloom Level 3 — Apply).
Set the temperatures and base temperature, pick a species and larval stage, and watch the calculator accumulate degree-hours backward until the running total crosses the threshold. Notice how a warmer log burns through the required degree-hours faster — meaning less real time has passed — while a colder log stretches the same ADH over more hours.
Procedure
Part 1 — Read the insect evidence.
- Measure the largest larvae from the scene with your metric ruler to the nearest millimeter. (In this case, 9 mm — always use the biggest, because they've been growing the longest.)
- Find 9 mm on the development chart. Read off two numbers: the larval stage it corresponds to and the ADH threshold — the accumulated degree-hours needed to grow a larva to that size for your species.
- Record the species' base temperature from the chart (for many blowflies this is around 10 °C).
Part 2 — Accumulate the degree-hours.
- Working backward from the hour of discovery, take each hourly temperature from the log and subtract the base temperature. That's the degree-hours for that hour. (If an hour is colder than the base temperature, it contributes zero — never a negative.)
- Keep a running cumulative total (the ADH) as you step back hour by hour.
- Stop at the hour where your cumulative ADH first reaches the threshold from Step 2. Count how many hours you stepped back — that span is your estimate.
Part 3 — Estimate and check (optional rearing extension).
- Convert the number of hours into a clear minimum PMI statement (for example, "at least 62 hours ≈ 2.6 days").
- Verify your math in the MicroSim, then compare your hand calculation to the sim's result.
- Optional (1–2 weeks): rear mealworms in oats — or run the sealed chicken-liver succession demo outdoors — measuring larval length every day to watch instar stages change in real time. Compare your observed growth rate to the development chart.
Data Collection
Fill in one row per hour, stepping backward from discovery.
| Hour (before discovery) | Temp (°C) | Base temp (°C) | Degree-hours (Temp − Base, min 0) | Cumulative ADH |
|---|---|---|---|---|
| 0 (discovery) | ||||
| −1 | ||||
| −2 | ||||
| −3 | ||||
| … | ||||
| Threshold reached at hour −___ | Threshold = |
Analysis Questions
- What ADH threshold did the development chart give for 9 mm larvae, and what minimum PMI did your back-calculation produce (in hours and days)?
- Why is this called a minimum PMI? Name one real-world factor that could make the true interval longer than your estimate.
- If the temperature log had been 5 °C warmer every hour, would your PMI estimate get longer or shorter? Explain using the idea of degree-hours.
- Why do investigators measure the largest larvae on the body rather than the average or the smallest?
- Identify two sources of error in this method — for example, in species identification, base temperature, or the temperature record — and explain how each would shift your estimate.
Deliverable
Turn in a one-page Forensic Entomology Report that states your estimated minimum post-mortem interval, shows your ADH accumulation table, and names the key assumptions behind the number. Frame the conclusion the way a real expert would: "The insect evidence indicates the body was exposed for at least ___ hours."
What Does the Data Tell Us?

The bug clock only counts forward from when the flies arrived — not from the exact instant of death. That's why entomologists say "minimum." A strong report states what the insects can prove (the body was here at least this long) and stays honest about the gap they can't see. Precision about your own uncertainty is what makes an expert believable in court.
Extension Challenge: The Cold Snap
Suppose the weather log shows a 12-hour cold snap where the temperature dropped below the base temperature. How does that stretch of "zero degree-hour" time change your PMI estimate compared to a steady warm spell with the same total hours? Rework the calculation with and without the cold snap and explain the difference to a jury in two sentences.
Teacher Notes
Setup, timing, and grading (click to expand)
- Prep: Provide each group a printed temperature log and a development chart keyed to one species (e.g., Calliphora vicina, base ≈ 10 °C). Pick numbers that make the threshold land cleanly so the arithmetic stays the focus, not the bookkeeping.
- The math is the lab. The core exercise needs no consumables — it's a degree-hour accumulation. The MicroSim is the answer key and lets groups test "what if it were warmer?" scenarios quickly.
- Optional rearing: Mealworms are the safe, odor-free choice for watching real instar growth. Reserve the chicken-liver succession demo for outdoor, well-sealed setups only, and clear it with your building policy first.
- Differentiation: For a shorter version, give the ADH threshold directly and have students only accumulate the log. For a challenge, hand them raw larvae photos to measure and identify the species themselves.
- Assessment focus: Reward students who never write "negative degree-hours," who correctly say minimum PMI, and who name a concrete assumption behind their estimate.
Case Closed — For Now

You just read a clock made of maggots and told a medical examiner something the body couldn't. Nine millimeters of larva, an hourly thermometer, and a little arithmetic — that's a timeline no alibi can argue with. Nicely counted, investigators. Follow the evidence!