Trace and Watch
Bug 5 in the broken faces lab was invisible. Nothing looked wrong in a photograph of the screen; the program was just too slow to notice a finger. You cannot find a bug like that by staring at the code, and you certainly cannot find it by guessing.
You have to measure.
Let's build an instrument
 This lab turns my face into its own test equipment. Four numbers on screen, updated live, and suddenly a bug you could only feel becomes a bug you can read.
Four Numbers That Tell You What Is Really Happening
The heads-up display reports these, and the same numbers go to the Thonny shell once a second so you have a record you can scroll back through:
| Reading | What it means |
|---|---|
loops |
How many times the main loop has run since it started |
fps |
Loops per second — the real speed of your program |
A / B |
What each button pin reads right now (1 = up, 0 = pressed) |
hit |
How many presses the program actually managed to notice |
The panel takes the top and bottom strips of the circle and leaves the middle to the face, so the instruments never sit on top of what they are measuring.
1 2 3 4 5 6 | |
Two Switches, Two Ways to Break It
The lab ships with two flags at the top, both set to False. Each one breaks the program in a
completely different way and produces the same symptom.
1 2 3 4 5 6 7 8 | |
| Flag | What it does | Why fps collapses |
|---|---|---|
SLOW_MODE |
Adds a 300 ms sleep() per loop |
The program is asleep instead of working |
FULL_REDRAW |
Redraws the whole face every frame | The program is busy sending 115,200 bytes |
Identical symptom, unrelated causes. That is why you measure instead of guessing.
The Instrument Measures a Different Thing Here
One difference from the OLED version is worth noticing. There, the fps you measured was almost
entirely your code's speed, because show() cost the same 8 milliseconds no matter what.
Here, drawing is sending, so this fps number is dominated by how many pixels you chose to touch. The instrument measures a different thing on different hardware, which is a good thing to know about instruments in general.
Counting Frames Between Two Clock Readings
 Every game, every robot, and every video player measures its own speed exactly the way this lab does: count how many times you did the thing, then divide by how long it took. That is the whole technique.
Sample Program Code
1 2 3 4 5 6 7 8 9 10 11 12 13 14 15 16 17 18 19 20 21 22 23 24 25 26 27 28 29 30 31 32 33 34 35 36 37 38 39 40 41 42 43 | |
The full program is 26-trace-and-watch.py in the kit.
Here's the instrument running:
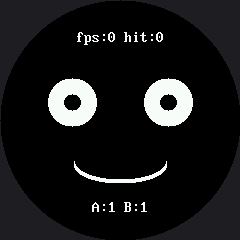
Both buttons read 1 in that picture, which is what "not pressed" looks like. The fps figure needs a full second of running before it has anything to report.
Watch the Buttons Change in Real Time
 Hold button A down and watch
 A:1 become A:0. That single digit answers "is my wiring right?" faster than any amount of code reading, and it will save you an afternoon at some point.
Things to Try
- Run it as-is and note the fps. Then set
SLOW_MODE = Trueand note it again. Write both numbers down — that ratio is the bug, expressed as a number instead of a feeling. - Now leave
SLOW_MODEoff and setFULL_REDRAW = True. The program still never sleeps, and the fps still collapses. Two causes, one symptom. - With
SLOW_MODEon, tap button A ten times as fast as you can. Compare thehitcounter to ten. Every missing press was swallowed by asleep(). - Lower
SLOW_DELAY_MSuntil presses stop getting lost. The number you land on is roughly how long a human finger stays on a button — you just measured a person with a microcontroller. - Comment out
draw_panel()for ten seconds and watch fps jump. Two text strips are not free either, which is exactly the question the next lab answers.
References
- Five Broken Faces — bug 5, the invisible one this lab was built to catch
- Don't Block the Loop — the
ticks_ms()pattern the blink timer uses - Only Redraw What Changed — where measurement turns into optimization