Cyber Kill Chain Phases with Defensive Controls
Run the Cyber Kill Chain Controls MicroSim Fullscreen
You can include this MicroSim on your own website with the following iframe:
<iframe src="https://dmccreary.github.io/cybersecurity/sims/cyber-kill-chain-controls/main.html" height="430" width="100%" scrolling="no"></iframe>
About this MicroSim
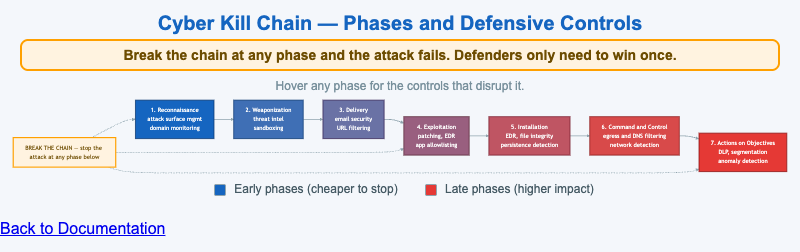
This diagram lays out the seven phases of the Cyber Kill Chain as a left-to-right flow — Reconnaissance, Weaponization, Delivery, Exploitation, Installation, Command and Control, and Actions on Objectives. The boxes shade from cybersecurity blue at the early, cheap-to-stop phases to red at the late, high-impact phases, so the cost gradient of waiting to respond is visible at a glance.
Each phase box lists the defensive controls that disrupt it, and hovering (or tapping) a phase reveals a fuller description of what the attacker is doing there and the controls that break it. Above the flow, the amber "Break the Chain" callout feeds a dashed arrow into every phase to make the central idea concrete: a defender does not have to win at every phase — disrupting any single phase makes the whole attack fail. That asymmetry, in the defender's favor for once, is the reason defense-in-depth across the chain is so effective.
Lesson Plan
Learning objective (Bloom — Understand): Students can map each Cyber Kill Chain phase to the controls that disrupt it and explain why breaking the chain at any one phase defeats the attack.
Suggested classroom use: Walk the chain left to right, hovering each phase to read its controls. Then ask students to pick the phase they would invest in first and defend the choice on cost and blast-radius grounds. Connect the controls to tools the class has already seen (EDR, DNS filtering, DLP).
Discussion questions:
- Why is it generally cheaper and safer to break the chain at Reconnaissance or Delivery than at Actions on Objectives?
- Several controls (EDR, for example) appear in more than one phase. What does that tell you about how to prioritize tooling?
- The model assumes a linear attack. Where does the real world deviate from this neat left-to-right sequence?
References
- Cyber kill chain (Wikipedia)
- Lockheed Martin — The Cyber Kill Chain
- MITRE ATT&CK (a complementary, non-linear model)
Specification
The full specification below is extracted from Chapter 2: "Threats, Vulnerabilities, and Security Controls".
Type: workflow-diagram
**sim-id:** cyber-kill-chain-controls<br/>
**Library:** Mermaid<br/>
**Status:** Specified

A horizontal flow with 7 boxes representing the kill chain phases:

1. **Reconnaissance** → controls: external attack surface management, domain monitoring
2. **Weaponization** → controls: threat intelligence, sandboxing, anti-exploit
3. **Delivery** → controls: email security, URL filtering, attachment scanning
4. **Exploitation** → controls: patching, EDR, application allowlisting
5. **Installation** → controls: EDR, file integrity monitoring, persistence detection
6. **Command and Control** → controls: egress filtering, DNS filtering, network detection
7. **Actions on Objectives** → controls: DLP, segmentation, anomaly detection

Each phase is a colored box (gradient from blue at left to red at right). Below each phase, a small list of 2-3 control examples appears. Arrows between phases imply progression. A "break the chain" callout sits above the flow, with a downward arrow into each phase, captioned: "Stop the chain at any phase and the attack fails."

Color: cybersecurity blue (#1565c0) shading deeper through the chain. Responsive: stacks vertically below 800px viewport with phase titles and bullet lists.

Implementation: Mermaid graph LR with styled subgraphs.