The Operations Monitoring Pipeline
Run the Ops Monitoring Pipeline MicroSim Fullscreen
You can include this MicroSim on your own website with the following iframe:
<iframe src="https://dmccreary.github.io/cybersecurity/sims/ops-monitoring-pipeline/main.html" height="892" width="100%" scrolling="no"></iframe>
About this MicroSim
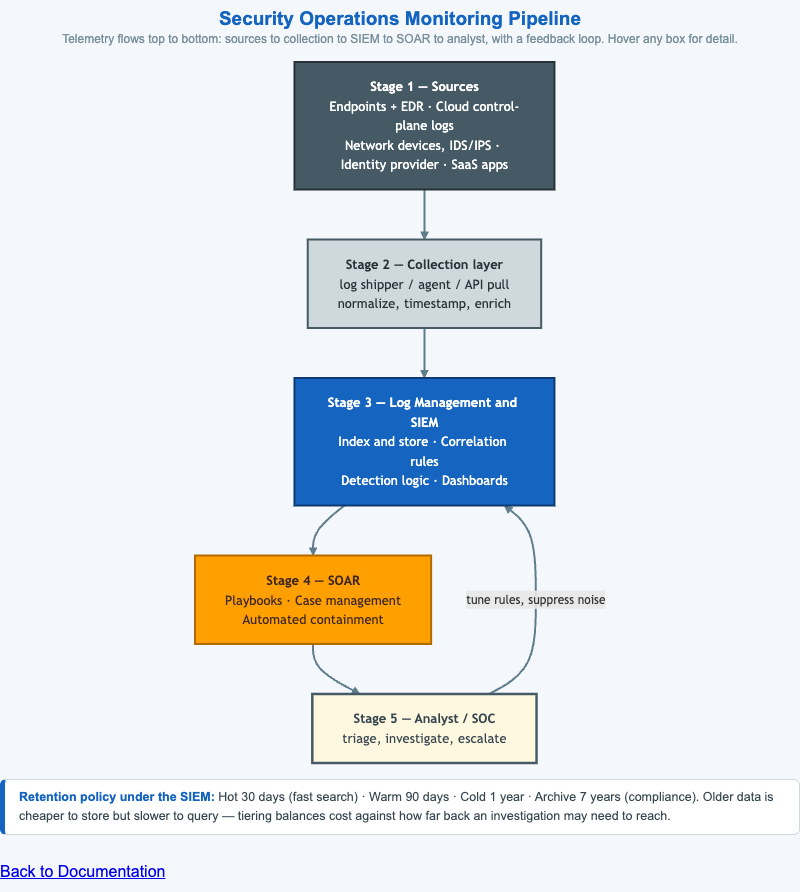
This diagram follows security telemetry through the five stages of a security operations monitoring pipeline. Stage 1 — Sources is everything that emits logs: endpoints with EDR agents, cloud control-plane logs, network devices and IDS/IPS, the identity provider, and SaaS apps — each in its own format. Stage 2 — the Collection layer (a log shipper, agent, or API pull) normalizes those formats, applies consistent timestamps, and enriches the events. Stage 3 — the SIEM indexes and stores the data, runs correlation rules and detection logic, and drives dashboards. Stage 4 — SOAR adds playbooks, case management, and automated containment. Stage 5 — the SOC analyst triages, investigates, and escalates.
Two details carry the real lesson. The feedback edge from the analyst back to the SIEM ("tune rules, suppress noise") shows that monitoring is a loop, not a one-way pipe — the analyst's experience continuously improves the detection logic. And the retention strip below the diagram shows that logs are tiered by age — hot (30 days), warm (90 days), cold (1 year), archive (7 years for compliance) — trading query speed for storage cost rather than simply deleting old data. Hover any stage for detail.
Lesson Plan
Learning objective (Bloom — Understand): Students can describe the stages telemetry passes through from source to SOC analyst and explain the analyst-to-SIEM feedback loop and the purpose of tiered log retention.
Suggested classroom use: Trace a single suspicious login from the identity provider all the way to an analyst decision, hovering each stage. Then ask why the feedback edge exists and what happens to a SOC that never tunes its rules.
Discussion questions:
- Why does the collection layer normalize and enrich events before they reach the SIEM rather than letting the SIEM handle raw formats?
- What problem does the analyst-to-SIEM feedback loop solve, and what is "alert fatigue"?
- Why move aging logs to cheaper, slower storage tiers instead of deleting them?
References
- Security information and event management (Wikipedia)
- Security orchestration, automation and response (Wikipedia)
- Security operations center (Wikipedia)
Specification
The full specification below is extracted from Chapter 11: "Cloud Security and Operations Monitoring".
Type: drawing
**sim-id:** ops-monitoring-pipeline<br/>
**Library:** Mermaid<br/>
**Status:** Specified

A left-to-right pipeline diagram with five stages.

**Stage 1 — Sources (left column, stacked vertically):**

- Endpoints (workstations, servers) with EDR agents
- Cloud control-plane logs (CloudTrail, Activity Log, Audit Log)
- Network devices (firewalls, IDS/IPS)
- Identity provider (Okta, Entra ID, AD)
- SaaS applications (M365, Salesforce, GitHub)

**Stage 2 — Collection layer (single rounded box):**

- "Log shipper / agent / API pull" (e.g., Fluent Bit, Splunk forwarder, cloud-native collector)
- Annotation: "normalize, timestamp, enrich"

**Stage 3 — Log management & SIEM (large central box, cybersecurity blue):**

- Sub-boxes inside: "Index & store", "Correlation rules", "Detection logic", "Dashboards"

**Stage 4 — SOAR (parallel right-hand box):**

- Sub-boxes: "Playbooks", "Case management", "Automated containment"

**Stage 5 — Analyst / SOC (rightmost, with a small Sentinel-fox-like silhouette icon):**

- Annotation: "Triage, investigate, escalate"

Arrows from sources → collection → SIEM. Arrow from SIEM → SOAR → Analyst. A back-arrow from Analyst → SIEM ("tune rules, suppress noise") shows the feedback loop.

A retention-policy strip runs underneath the SIEM box: "Hot: 30 days, Warm: 90 days, Cold: 1 year, Archive: 7 years (compliance)".

Color: cybersecurity blue for the SIEM core, slate steel for collection and sources, accent amber on SOAR. Responsive: pipeline stacks vertically below 900px.

Implementation: Mermaid graph LR with subgraphs.