Security Operations Activity Map
You can include this MicroSim on your own page with the following iframe:
<iframe src="https://dmccreary.github.io/cybersecurity/sims/secops-activity-map/main.html" height="722" width="100%" scrolling="no"></iframe>
About this MicroSim
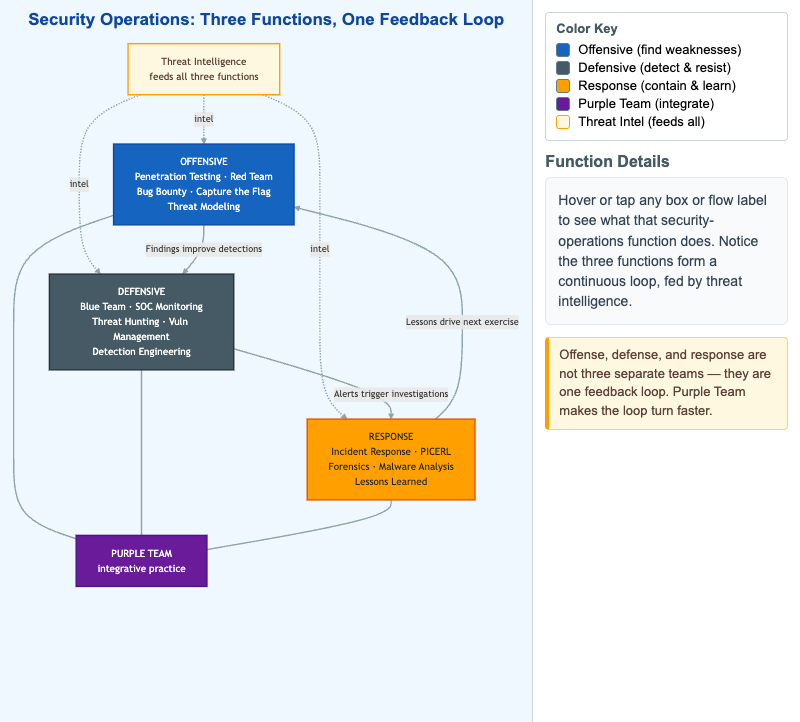
Security operations is often taught as three disconnected job families, but this map shows them as one continuous feedback loop. The Offensive function (penetration testing, red team, bug bounty, capture-the-flag, threat modeling) finds weaknesses and hands its findings to the Defensive function (blue team, SOC monitoring, threat hunting, vulnerability management, detection engineering), which turns them into detections. When a detection fires, its alert triggers an investigation in the Response function (incident response, the PICERL lifecycle, forensics, malware analysis, lessons learned). The lessons from an incident then drive the next offensive exercise, closing the loop.
Two cross-cutting elements bind the loop together. Purple Team sits in the center, connected to all three functions, representing the integrative practice of running attack and defense together so the loop turns faster. Threat Intelligence feeds all three functions (shown with dashed intel arrows), because the same adversary knowledge informs what offense emulates, what defense detects, and how response attributes an incident. Hover over (or tap) any box to read what that function does in the right-hand panel; the color key separates the three functions, the purple integrator, and the cream threat-intel input.
Lesson Plan
Learning objective (Bloom: Understand). Students will relate the offensive, defensive, and response functions of security operations, explain how findings, alerts, and lessons cycle between them, and describe the integrative role of the purple team and the shared role of threat intelligence.
Suggested classroom use. Project the map and trace a single concrete finding all the way around the loop — for example, a red-team-discovered misconfiguration becomes a new detection rule, the rule later fires on a real intrusion, the incident's lessons-learned then define next quarter's red-team scope. Then have students sort a list of real job titles (SOC analyst, pentester, DFIR lead, detection engineer) into the three functions.
Discussion questions:
- Pick one function and explain what breaks in the other two functions if it is missing or under-resourced.
- Why does a purple team make the loop turn faster than three siloed teams that exchange reports? What feedback latency does it remove?
- Threat intelligence feeds all three functions. Give one concrete way each function consumes the same piece of intel differently.
References
- Security operations center — Wikipedia
- Red team — Wikipedia
- Blue team (computer security) — Wikipedia
- Cyber threat intelligence — Wikipedia
Specification
The full specification below is extracted from Chapter 15: "Offensive and Defensive Security Operations".
Type: diagram
sim-id: secops-activity-map
Library: Mermaid
Status: Specified

A triangle layout with three major nodes at each vertex:

- Offensive (top, cybersecurity blue #1565c0): Penetration Testing, Red Team, Bug Bounty, Capture the Flag, Threat Modeling
- Defensive (bottom-left, slate steel #455a64): Blue Team, SOC Monitoring, Threat Hunting, Vulnerability Management, Detection Engineering
- Response (bottom-right, alert accent #ffa000): Incident Response, PICERL, Forensics, Malware Analysis, Lessons Learned

Three connecting flows:

1. Offensive -> Defensive: "Findings improve detections"
2. Defensive -> Response: "Alerts trigger investigations"
3. Response -> Offensive: "Lessons drive next exercise"

A central node labeled Purple Team sits in the middle, connected to all three vertices, representing the integrative practice.

Around the outside, a thin arc labeled Threat Intelligence feeds all three vertices, indicating intel is consumed by all functions.

Color palette: cybersecurity blue (#1565c0), slate steel (#455a64), alert accent (#ffa000). Background: white. Responsive: stacks vertically below 700px viewport.

Implementation: Mermaid graph TD with custom node styling and color coding.