Cost of Fixing a Bug Across SDLC Phases
Run the SSDLC Cost Curve MicroSim Fullscreen
You can include this MicroSim on your own website with the following iframe:
<iframe src="https://dmccreary.github.io/cybersecurity/sims/ssdlc-cost-curve/main.html" height="472" width="100%" scrolling="no"></iframe>
About this MicroSim
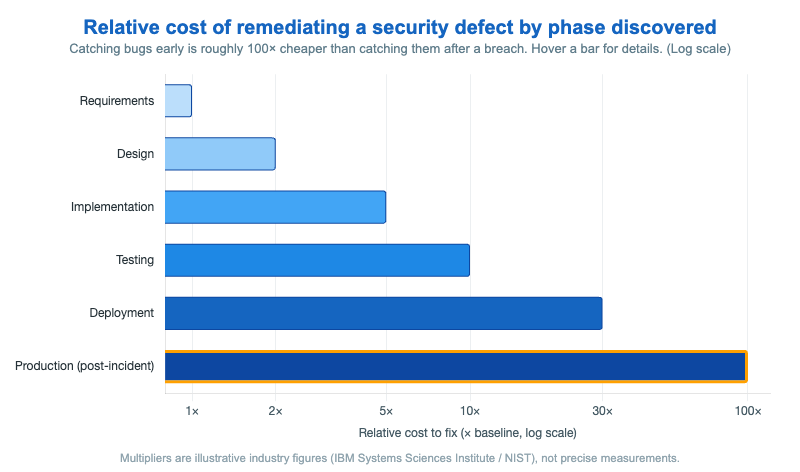
This chart is the single strongest economic argument for "shifting security left." It plots the relative cost of remediating a security defect against the phase in which the defect is discovered, from Requirements (1×) through Design (2×), Implementation (5×), Testing (10×), Deployment (30×), and finally Production after a breach (100×).
The x-axis is logarithmic on purpose: the cost grows geometrically, so a linear axis would crush the early phases into a single sliver and hide the shape of the curve. The bars use a cybersecurity-blue gradient that darkens with cost, and the Production bar carries an alert-amber border to mark the worst case. Hover (or tap) any bar to see that phase's typical security activities (threat modeling, code review, fuzzing, incident response) and the concrete driver of its cost. The headline takeaway: a flaw caught in requirements is a sentence edited in a document; the same flaw caught after a breach is incident response, forensics, disclosure, and lost trust.
Lesson Plan
Learning objective (Bloom — Understand): Students can interpret the logarithmic cost curve, explain why remediation cost grows geometrically with the phase of discovery, and argue for shifting security activities earlier.
Suggested classroom use: Before revealing the numbers, ask students to guess the cost ratio between fixing a bug in design versus in production. Then reveal the chart and hover each bar to connect a phase to its activities. Close by asking where a team with budget for exactly one new security activity should invest.
Discussion questions:
- Why is the x-axis logarithmic rather than linear? What would a linear axis hide?
- The 100× figure is an industry estimate, not a measurement. Does the argument depend on the exact number?
- Name one security activity for each phase and explain what class of defect it is best at catching.
References
- Shift-left testing (Wikipedia)
- Software development process (Wikipedia)
- NIST SP 800-218 — Secure Software Development Framework (SSDF)
Specification
The full specification below is extracted from Chapter 5: "Software Vulnerabilities and Secure Coding".
Type: chart
**sim-id:** ssdlc-cost-curve<br/>
**Library:** Chart.js<br/>
**Status:** Specified

A horizontal bar chart with phases on the y-axis and relative cost on the x-axis (logarithmic scale).

Bars (top to bottom):

- **Requirements**: 1x (lightest blue)
- **Design**: 2x
- **Implementation**: 5x
- **Testing**: 10x
- **Deployment**: 30x
- **Production (post-incident)**: 100x (darkest blue, with red border)

Title: "Relative cost of remediating a security defect by phase discovered."

Subtitle: "Catching bugs early is roughly 100x cheaper than catching them after a breach."

Color palette: cybersecurity blue gradient (`#bbdefb` to `#0d47a1`), with the production bar bordered in alert amber (`#ffa000`).

Hovering on each bar shows: phase name, typical activities ("threat modeling", "code review", "fuzzing", "incident response"), and an example cost driver.

Responsive: rotates to vertical layout below 600px viewport. Title remains visible.

Implementation: Chart.js horizontal bar chart with logarithmic x-axis and custom tooltip callbacks.