RTO and RPO Timeline
Run the RTO and RPO Timeline Fullscreen
You can include this MicroSim on your own website with the following iframe:
<iframe src="https://dmccreary.github.io/cybersecurity/sims/rto-rpo-timeline/main.html" height="472" width="100%" scrolling="no"></iframe>
About this MicroSim
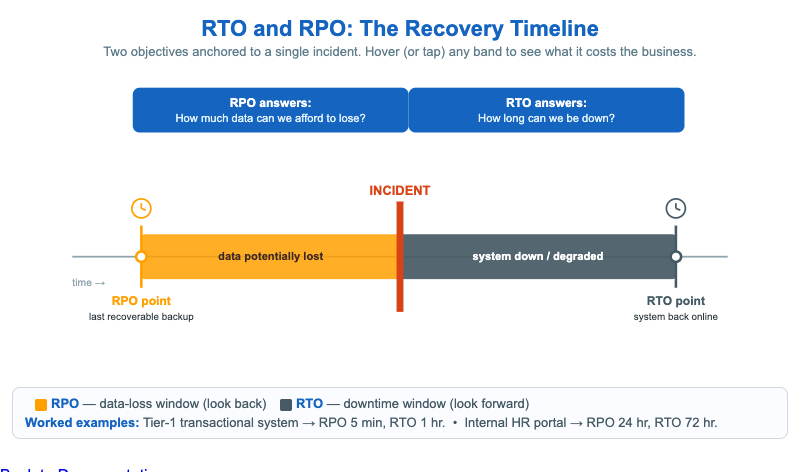
This infographic puts two business-continuity objectives on a single timeline so students stop confusing them. A red INCIDENT bar marks time zero — the outage, breach, or data corruption that starts the recovery clock. Everything to the left of the incident is the Recovery Point Objective (RPO): the amber band runs from the last recoverable backup up to the incident, and any data written in that window is potentially lost. Everything to the right is the Recovery Time Objective (RTO): the slate band runs from the incident until the system is back online, the window during which the business is down or degraded.
Two blue callout boxes frame the question each objective answers — RPO asks "how much data can we afford to lose?" and RTO asks "how long can we be down?" Hover (or tap on a touch screen) any band or marker to read what that window costs the business. A legend underneath gives two worked examples that show how the numbers differ by system tier. Below 600px the timeline rotates to a vertical layout so it stays readable on phones.
Lesson Plan
Learning objective (Bloom — Understand): Students can distinguish RPO from RTO, state which direction in time each measures, and read an example pair of values for a given system.
Suggested classroom use: Project the timeline and ask students to point — not say — which side of the incident is RPO and which is RTO before revealing the tooltips. Then give them a system (a payroll database, a marketing blog, an emergency dispatch console) and have them propose an RPO/RTO pair and justify it from the cost of data loss versus the cost of downtime.
Discussion questions:
- A team sets RPO to 5 minutes but RTO to 24 hours. What does that combination imply about their backup strategy versus their failover strategy?
- Why is "RPO = 0" effectively impossible, and what does chasing it cost?
- Two systems have identical RTOs but very different RPOs. Give a real example and explain why.
References
- Disaster recovery — Recovery objectives (Wikipedia)
- Recovery point objective (Wikipedia)
- NIST SP 800-34 Rev. 1 — Contingency Planning Guide
Specification
The full specification below is extracted from Chapter 13: "Organizational Security: Governance, Risk, and Compliance".
Type: infographic-svg
**sim-id:** rto-rpo-timeline<br/>
**Library:** Static SVG with hover tooltips<br/>
**Status:** Specified

A horizontal timeline 900px wide:

- Center marker labeled "INCIDENT" (red vertical bar) — time 0.
- Left of incident: a clock icon and label "RPO — last recoverable backup". A bracketed segment from "RPO point" to "INCIDENT" colored amber. Tooltip: "Data written between the RPO point and the incident is potentially lost."
- Right of incident: a clock icon and label "RTO — system back online". A bracketed segment from "INCIDENT" to "RTO point" colored slate steel. Tooltip: "The business is degraded or down throughout this window."
- Above the timeline, two callout boxes:
  - "RPO answers: How much data can we afford to lose?"
  - "RTO answers: How long can we be down?"
- Below the timeline, a small example legend: "Tier-1 transactional system: RPO 5 min, RTO 1 hr. Internal HR portal: RPO 24 hr, RTO 72 hr."

Color: incident bar #d84315; RPO segment #ffa000; RTO segment #455a64; callouts #1565c0 with white text.

Responsive: SVG scales with container; below 600px, the timeline rotates to vertical with labels on the right. Window-resize listener re-renders.

Implementation: Inline SVG with `<title>` tooltips and a small resize handler.