Network Telemetry Stack
You can include this MicroSim on your own page with the following iframe:
<iframe src="https://dmccreary.github.io/cybersecurity/sims/network-telemetry-stack/main.html" height="502" width="100%" scrolling="no"></iframe>
About this MicroSim
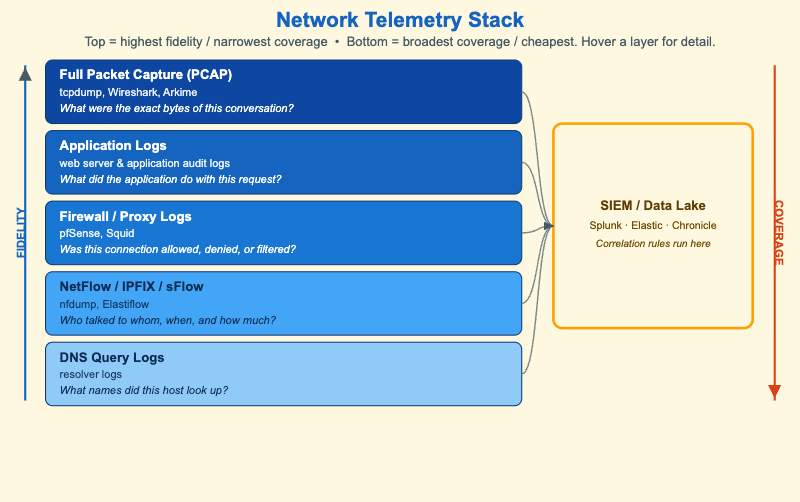
This diagram lays out the five telemetry sources a security operations team relies on, stacked from highest fidelity at the top to broadest coverage at the bottom. Each layer names the data type, an example tool, and — most usefully — the kind of question it can answer:
- Full packet capture (PCAP) answers "what were the exact bytes?"
- Application logs answer "what did the app do with this request?"
- Firewall / proxy logs answer "allowed, denied, or filtered?"
- NetFlow / IPFIX / sFlow answer "who talked to whom, when, and how much?"
- DNS query logs answer "what names did this host look up?"
All five feed the SIEM / data lake on the right, where correlation rules run across the combined evidence. The two axes flanking the stack capture the core trade-off: fidelity increases toward the top (full PCAP is the gold standard for content) while coverage increases toward the bottom (DNS logs are cheap enough to keep for everything). The amber note states the practical consequence — because storage cost roughly tracks fidelity, most teams keep PCAP only on-demand and NetFlow always-on.
The point of the diagram is to help an analyst pick the right source for a question rather than reaching for the most expensive one by default. Hover (or tap) any layer for a short note on what it is best at and why teams keep it on-demand or always-on.
Lesson Plan
Learning objective (Bloom: Understand). Students will identify the five common network telemetry sources and the question each answers, compare them along the fidelity, coverage, and storage-cost dimensions, and explain why broad cheap telemetry is kept always-on while high-fidelity capture is on-demand.
Suggested classroom use. Give students a set of investigative questions ("Did host X exfiltrate data?", "What domain did the malware beacon to?", "Was the connection blocked at the perimeter?") and have them name the cheapest telemetry layer that can answer each one.
Discussion questions:
- Why is DNS query logging often the highest-value, lowest-cost telemetry a team can turn on?
- Full packet capture answers the most questions but is rarely retained for long. What drives that decision, and how do teams compensate?
- The SIEM correlates across all five layers. Why is correlation more powerful than any single source on its own?
References
- Security information and event management — Wikipedia
- NetFlow — Wikipedia
- Packet analyzer — Wikipedia
- Network monitoring — Wikipedia
Specification
The full specification below is extracted from Chapter 9: "Advanced Network Defense: Wireless, DNS, and Zero Trust".
Type: diagram
sim-id: network-telemetry-stack
Library: Static SVG with hover tooltips (spec named Mermaid; see note below)
Status: Specified

A vertical layered diagram with five telemetry layers (top = most expensive /
highest fidelity, bottom = cheapest / broadest coverage): full packet capture
(PCAP), application logs, firewall/proxy logs, NetFlow/IPFIX/sFlow, and DNS query
logs. Each layer shows the data type, an example tool, and the question it answers.
An aggregator feeds all five into a SIEM / data lake where correlation rules run.

Annotations: a Coverage arrow on the left increasing top to bottom; a Fidelity
arrow on the right increasing bottom to top; a cost note that storage cost tracks
fidelity, so teams keep PCAP on-demand and NetFlow always-on.

Color: cybersecurity blue for the layers; cream for the SIEM box.

Implementation note: the spec named Mermaid, but a five-layer vertical stack with a
side SIEM renders far more compactly and legibly as inline SVG (a Mermaid flowchart
blows the node text up under useMaxWidth in a wide iframe). This MicroSim is built
as responsive inline SVG with per-layer hover tooltips.