Threat Actor Capability Matrix
You can include this MicroSim on your own page with the following iframe:
<iframe src="https://dmccreary.github.io/cybersecurity/sims/threat-actor-matrix/main.html" height="542" width="100%" scrolling="no"></iframe>
About this MicroSim
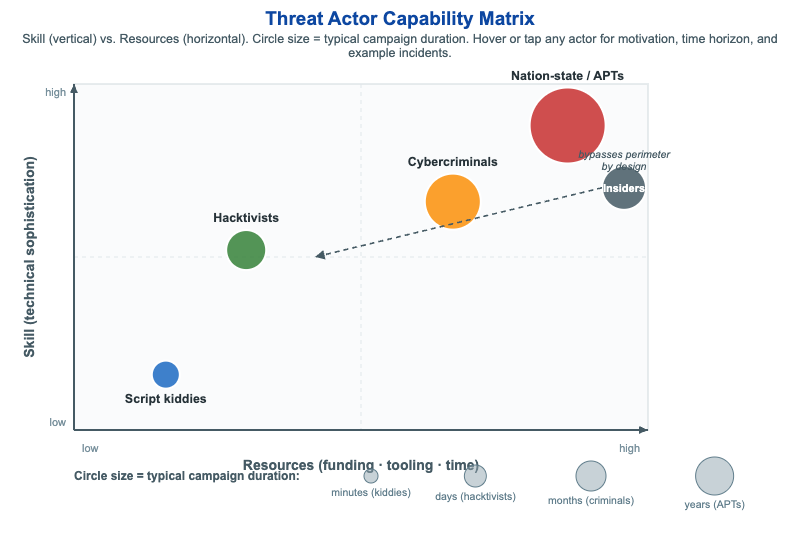
This MicroSim plots five common threat actor types on a two-dimensional matrix: the horizontal axis is Resources (funding, tooling, and time) and the vertical axis is Skill (technical sophistication). Each actor is drawn as a circle whose size encodes its typical campaign duration — script kiddies act in minutes, while nation-state APTs run patient campaigns over years. Hovering or tapping any circle reveals a tooltip with that actor's typical motivation, time horizon, and real-world example incidents.
The plot makes the central insight visible at a glance: the most dangerous actors cluster in the upper-right quadrant, where high skill and deep resources let them sustain long, targeted campaigns. Script kiddies sit lower-left (low skill, low resources, opportunistic), hacktivists are mid-left (ideologically driven, moderate skill), and cybercriminals occupy the middle-right (profit-motivated, well-resourced). Insiders are deliberately drawn off the skill/resources axes with a callout arrow reading "bypasses perimeter by design" — their threat is not sophistication but trusted access, which is why they need their own treatment in any threat model.
Lesson Plan
Learning objective (Bloom: Analyze). Students will place common threat actor types on a Skill vs. Resources matrix, compare them by motivation, time horizon, and example incidents, and explain why insiders are an off-axis threat that bypasses the perimeter by design.
Suggested classroom use. Project the matrix and ask students, before revealing tooltips, to predict where each actor belongs and why. Then hover each circle to check their reasoning. Connect circle size to defensive posture: a defender's mean time to detect must be shorter than the attacker's dwell time — easy against minutes- long script-kiddie noise, very hard against a multi-year APT campaign.
Discussion questions:
- Two actors can sit at the same skill level but very different resource levels. How does that change the kind of attack each can sustain, and the defense you need?
- Why are insiders modeled off the skill/resources axes instead of as just another point on the plot? What control assumptions do they break?
- The most damaging breaches often come from the upper-right (APTs) — but the most frequent attacks come from the lower-left. How should that shape where a small organization spends its limited security budget?
References
- Threat actor — Wikipedia
- Advanced persistent threat — Wikipedia
- Hacktivism — Wikipedia
- Insider threat — Wikipedia
Specification
The full specification below is extracted from Chapter 2: "Threats, Vulnerabilities, and Security Controls".
Type: infographic-svg
**sim-id:** threat-actor-matrix
**Library:** Static SVG with hover tooltips
**Status:** Specified

A 2D scatter plot:
- X-axis: Resources (low -> high)
- Y-axis: Skill (low -> high)

Five labeled circles positioned in the appropriate quadrants:
- Script kiddies (low skill, low resources, lower-left): blue #1565c0, small radius
- Hacktivists (mixed skill, low-moderate resources, middle-left): green, medium radius
- Cybercriminals (high skill, moderate-high resources, middle-right): orange #fb8c00, larger radius
- Insiders (variable skill, low resources but unique access, special placement on a separate annotation): slate steel #455a64, with a callout arrow indicating "bypasses perimeter by design"
- Nation-state actors / APTs (highest skill, highest resources, upper-right): red #c62828, largest radius

Each circle has a hover tooltip listing typical motivations, time horizons, and example incidents. A legend at the bottom maps circle size to "typical campaign duration" (kiddies = minutes, APTs = years).

Color background should be neutral white. Responsive design that reflows axes at narrow widths.

Implementation: Static SVG with `<title>` elements; could be enhanced later as a clickable infographic.